Osage vs Hungarian Unemployment Among Seniors over 75 years

COMPARE

Osage
Race
Ancestry
AfghanAfricanAlaska NativeAlaskan AthabascanAlbanianAleutAlsatianAmericanApacheArabArapahoArgentineanArmenianAssyrian/Chaldean/SyriacAustralianAustrianBahamianBangladeshiBarbadianBasqueBelgianBelizeanBermudanBhutaneseBlackfeetBolivianBrazilianBritishBritish West IndianBulgarianBurmeseCajunCambodianCanadianCape VerdeanCarpatho RusynCelticCentral AmericanCentral American IndianCherokeeCheyenneChickasawChileanChineseChippewaChoctawColombianColvilleComancheCosta RicanCreeCreekCroatianCrowCubanCypriotCzechCzechoslovakianDanishDelawareDominicanDutchDutch West IndianEastern EuropeanEcuadorianEgyptianEnglishEstonianEthiopianEuropeanFijianFilipinoFinnishFrenchFrench American IndianFrench CanadianGermanGerman RussianGhanaianGreekGuamanian/ChamorroGuatemalanGuyaneseHaitianHmongHonduranHopiHoumaIcelanderIndian (Asian)IndonesianInupiatIranianIraqiIrishIroquoisIsraeliItalianJamaicanJapaneseJordanianKenyanKiowaKoreanLaotianLatvianLebaneseLiberianLithuanianLumbeeLuxembourgerMacedonianMalaysianMalteseMarshalleseMexicanMexican American IndianMongolianMoroccanNative HawaiianNavajoNepaleseNew ZealanderNicaraguanNigerianNorthern EuropeanNorwegianOkinawanOsageOttawaPaiutePakistaniPalestinianPanamanianParaguayanPennsylvania GermanPeruvianPimaPolishPortuguesePotawatomiPuebloPuerto RicanPuget Sound SalishRomanianRussianSalvadoranSamoanScandinavianScotch-IrishScottishSeminoleSenegaleseSerbianShoshoneSierra LeoneanSiouxSlavicSlovakSloveneSomaliSouth AfricanSouth AmericanSouth American IndianSoviet UnionSpaniardSpanishSpanish AmericanSpanish American IndianSri LankanSubsaharan AfricanSudaneseSwedishSwissSyrianTaiwaneseThaiTlingit-HaidaTohono O'OdhamTonganTrinidadian and TobagonianTsimshianTurkishU.S. Virgin IslanderUgandanUkrainianUruguayanUteVenezuelanVietnameseWelshWest IndianYakamaYaquiYugoslavianYumanYup'ikZimbabwean
Immigration
NonimmigrantsImmigrantsAfghanistanAfricaAlbaniaArgentinaArmeniaAsiaAustraliaAustriaBahamasBangladeshBarbadosBelarusBelgiumBelizeBoliviaBosnia and HerzegovinaBrazilBulgariaBurma/MyanmarCabo VerdeCambodiaCameroonCanadaCaribbeanCentral AmericaChileChinaColombiaCongoCosta RicaCroatiaCubaCzechoslovakiaDenmarkDominicaDominican RepublicEastern AfricaEastern AsiaEastern EuropeEcuadorEgyptEl SalvadorEnglandEritreaEthiopiaEuropeFijiFranceGermanyGhanaGreeceGrenadaGuatemalaGuyanaHaitiHondurasHong KongHungaryIndiaIndonesiaIranIraqIrelandIsraelItalyJamaicaJapanJordanKazakhstanKenyaKoreaKuwaitLaosLatin AmericaLatviaLebanonLiberiaLithuaniaMalaysiaMexicoMicronesiaMiddle AfricaMoldovaMoroccoNepalNetherlandsNicaraguaNigeriaNorth AmericaNorth MacedoniaNorthern AfricaNorthern EuropeNorwayOceaniaPakistanPanamaPeruPhilippinesPolandPortugalRomaniaRussiaSaudi ArabiaScotlandSenegalSerbiaSierra LeoneSingaporeSomaliaSouth AfricaSouth AmericaSouth Central AsiaSouth Eastern AsiaSouthern EuropeSpainSri LankaSt. Vincent and the GrenadinesSudanSwedenSwitzerlandSyriaTaiwanThailandTrinidad and TobagoTurkeyUgandaUkraineUruguayUzbekistanVenezuelaVietnamWest IndiesWestern AfricaWestern AsiaWestern EuropeYemenZaireZimbabweAzores
Hungarian
Race
Ancestry
AfghanAfricanAlaska NativeAlaskan AthabascanAlbanianAleutAlsatianAmericanApacheArabArapahoArgentineanArmenianAssyrian/Chaldean/SyriacAustralianAustrianBahamianBangladeshiBarbadianBasqueBelgianBelizeanBermudanBhutaneseBlackfeetBolivianBrazilianBritishBritish West IndianBulgarianBurmeseCajunCambodianCanadianCape VerdeanCarpatho RusynCelticCentral AmericanCentral American IndianCherokeeCheyenneChickasawChileanChineseChippewaChoctawColombianColvilleComancheCosta RicanCreeCreekCroatianCrowCubanCypriotCzechCzechoslovakianDanishDelawareDominicanDutchDutch West IndianEastern EuropeanEcuadorianEgyptianEnglishEstonianEthiopianEuropeanFijianFilipinoFinnishFrenchFrench American IndianFrench CanadianGermanGerman RussianGhanaianGreekGuamanian/ChamorroGuatemalanGuyaneseHaitianHmongHonduranHopiHoumaHungarianIcelanderIndian (Asian)IndonesianInupiatIranianIraqiIrishIroquoisIsraeliItalianJamaicanJapaneseJordanianKenyanKiowaKoreanLaotianLatvianLebaneseLiberianLithuanianLumbeeLuxembourgerMacedonianMalaysianMalteseMarshalleseMexicanMexican American IndianMongolianMoroccanNative HawaiianNavajoNepaleseNew ZealanderNicaraguanNigerianNorthern EuropeanNorwegianOkinawanOttawaPaiutePakistaniPalestinianPanamanianParaguayanPennsylvania GermanPeruvianPimaPolishPortuguesePotawatomiPuebloPuerto RicanPuget Sound SalishRomanianRussianSalvadoranSamoanScandinavianScotch-IrishScottishSeminoleSenegaleseSerbianShoshoneSierra LeoneanSiouxSlavicSlovakSloveneSomaliSouth AfricanSouth AmericanSouth American IndianSoviet UnionSpaniardSpanishSpanish AmericanSpanish American IndianSri LankanSubsaharan AfricanSudaneseSwedishSwissSyrianTaiwaneseThaiTlingit-HaidaTohono O'OdhamTonganTrinidadian and TobagonianTsimshianTurkishU.S. Virgin IslanderUgandanUkrainianUruguayanUteVenezuelanVietnameseWelshWest IndianYakamaYaquiYugoslavianYumanYup'ikZimbabwean
Immigration
NonimmigrantsImmigrantsAfghanistanAfricaAlbaniaArgentinaArmeniaAsiaAustraliaAustriaBahamasBangladeshBarbadosBelarusBelgiumBelizeBoliviaBosnia and HerzegovinaBrazilBulgariaBurma/MyanmarCabo VerdeCambodiaCameroonCanadaCaribbeanCentral AmericaChileChinaColombiaCongoCosta RicaCroatiaCubaCzechoslovakiaDenmarkDominicaDominican RepublicEastern AfricaEastern AsiaEastern EuropeEcuadorEgyptEl SalvadorEnglandEritreaEthiopiaEuropeFijiFranceGermanyGhanaGreeceGrenadaGuatemalaGuyanaHaitiHondurasHong KongHungaryIndiaIndonesiaIranIraqIrelandIsraelItalyJamaicaJapanJordanKazakhstanKenyaKoreaKuwaitLaosLatin AmericaLatviaLebanonLiberiaLithuaniaMalaysiaMexicoMicronesiaMiddle AfricaMoldovaMoroccoNepalNetherlandsNicaraguaNigeriaNorth AmericaNorth MacedoniaNorthern AfricaNorthern EuropeNorwayOceaniaPakistanPanamaPeruPhilippinesPolandPortugalRomaniaRussiaSaudi ArabiaScotlandSenegalSerbiaSierra LeoneSingaporeSomaliaSouth AfricaSouth AmericaSouth Central AsiaSouth Eastern AsiaSouthern EuropeSpainSri LankaSt. Vincent and the GrenadinesSudanSwedenSwitzerlandSyriaTaiwanThailandTrinidad and TobagoTurkeyUgandaUkraineUruguayUzbekistanVenezuelaVietnamWest IndiesWestern AfricaWestern AsiaWestern EuropeYemenZaireZimbabweAzores
Unemployment Among Seniors over 75 years
Income
Poverty
Unemployment
Labor Participation
Family Structure
Vehicle Availability
Education Level
Disability

Unemployment Among Seniors over 75 years Comparison

Osage

Hungarians

Fair
Tragic
8.9%
UNEMPLOYMENT AMONG SENIORS OVER 75 YEARS
25.4/ 100
METRIC RATING
200th/ 347
METRIC RANK
10.1%
UNEMPLOYMENT AMONG SENIORS OVER 75 YEARS
0.0/ 100
METRIC RATING
310th/ 347
METRIC RANK

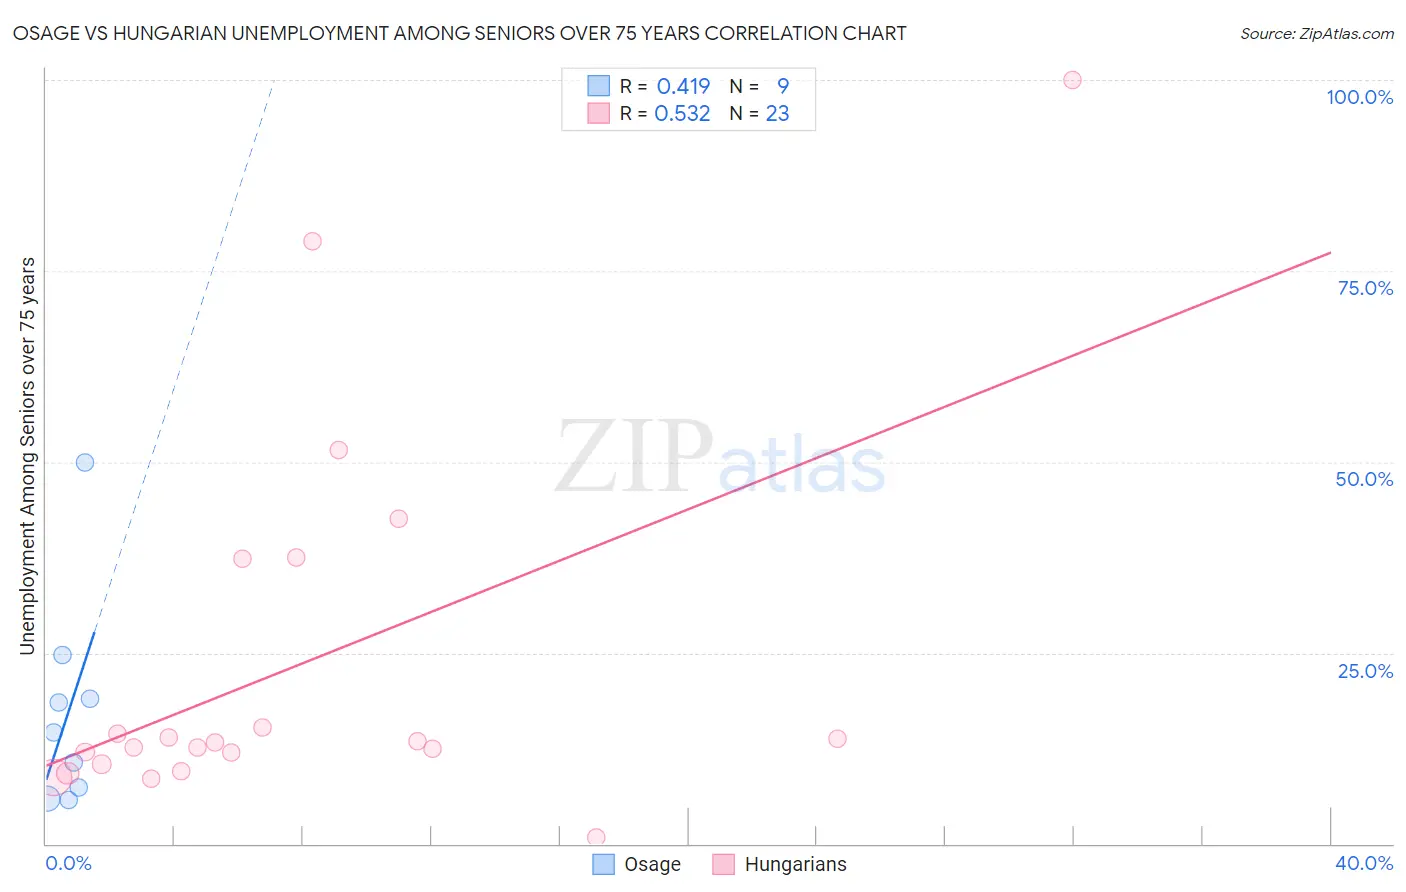
Osage vs Hungarian Unemployment Among Seniors over 75 years Correlation Chart

The statistical analysis conducted on geographies consisting of 70,055,038 people shows a moderate positive correlation between the proportion of Osage and unemployment rate among seniors over the age of 75 in the United States with a correlation coefficient (R) of 0.419 and weighted average of 8.9%. Similarly, the statistical analysis conducted on geographies consisting of 221,758,984 people shows a substantial positive correlation between the proportion of Hungarians and unemployment rate among seniors over the age of 75 in the United States with a correlation coefficient (R) of 0.532 and weighted average of 10.1%, a difference of 13.7%.
Osage vs Hungarian Unemployment Among Seniors over 75 years

Unemployment Among Seniors over 75 years Correlation Summary

MeasurementOsageHungarian
Minimum5.8%0.90%
Maximum50.0%100.0%
Range44.2%99.1%
Mean17.4%23.5%
Median14.6%13.2%
Interquartile 25% (IQ1)6.6%10.4%
Interquartile 75% (IQ3)21.9%37.3%
Interquartile Range (IQR)15.3%26.9%
Standard Deviation (Sample)13.9%24.5%
Standard Deviation (Population)13.1%23.9%

Similar Demographics by Unemployment Among Seniors over 75 years

Demographics Similar to Osage by Unemployment Among Seniors over 75 years

In terms of unemployment among seniors over 75 years, the demographic groups most similar to Osage are Pakistani (8.9%, a difference of 0.0%), Eastern European (8.9%, a difference of 0.030%), Immigrants from Laos (8.9%, a difference of 0.060%), Immigrants from Peru (8.9%, a difference of 0.080%), and Russian (8.9%, a difference of 0.090%).
DemographicsRating | RankUnemployment Among Seniors over 75 years
Immigrants | Guyana
29.9
/100
|
#193
Fair
8.8%
Maltese
29.2
/100
|
#194
Fair
8.8%
Okinawans
28.9
/100
|
#195
Fair
8.8%
Immigrants | Jamaica
27.7
/100
|
#196
Fair
8.9%
Immigrants | Laos
26.3
/100
|
#197
Fair
8.9%
Eastern Europeans
25.9
/100
|
#198
Fair
8.9%
Pakistanis
25.4
/100
|
#199
Fair
8.9%
Osage
25.4
/100
|
#200
Fair
8.9%
Immigrants | Peru
24.3
/100
|
#201
Fair
8.9%
Russians
24.1
/100
|
#202
Fair
8.9%
Immigrants | Northern Europe
23.9
/100
|
#203
Fair
8.9%
Spaniards
22.0
/100
|
#204
Fair
8.9%
Koreans
21.9
/100
|
#205
Fair
8.9%
Immigrants | Western Europe
18.2
/100
|
#206
Poor
8.9%
Malaysians
16.3
/100
|
#207
Poor
8.9%

Demographics Similar to Hungarians by Unemployment Among Seniors over 75 years

In terms of unemployment among seniors over 75 years, the demographic groups most similar to Hungarians are Scottish (10.1%, a difference of 0.11%), Chippewa (10.1%, a difference of 0.13%), English (10.1%, a difference of 0.19%), White/Caucasian (10.1%, a difference of 0.25%), and Nepalese (10.1%, a difference of 0.25%).
DemographicsRating | RankUnemployment Among Seniors over 75 years
Puget Sound Salish
0.0
/100
|
#303
Tragic
10.0%
Scotch-Irish
0.0
/100
|
#304
Tragic
10.0%
Swedes
0.0
/100
|
#305
Tragic
10.0%
Italians
0.0
/100
|
#306
Tragic
10.0%
Immigrants | Fiji
0.0
/100
|
#307
Tragic
10.0%
Whites/Caucasians
0.0
/100
|
#308
Tragic
10.1%
English
0.0
/100
|
#309
Tragic
10.1%
Hungarians
0.0
/100
|
#310
Tragic
10.1%
Scottish
0.0
/100
|
#311
Tragic
10.1%
Chippewa
0.0
/100
|
#312
Tragic
10.1%
Nepalese
0.0
/100
|
#313
Tragic
10.1%
Dutch West Indians
0.0
/100
|
#314
Tragic
10.2%
Pennsylvania Germans
0.0
/100
|
#315
Tragic
10.2%
Natives/Alaskans
0.0
/100
|
#316
Tragic
10.2%
Irish
0.0
/100
|
#317
Tragic
10.2%