Osage vs African Unemployment Among Ages 55 to 59 years
COMPARE
Osage
African
Unemployment Among Ages 55 to 59 years
Unemployment Among Ages 55 to 59 years Comparison
Osage
Africans
4.8%
UNEMPLOYMENT AMONG AGES 55 TO 59 YEARS
37.0/ 100
METRIC RATING
186th/ 347
METRIC RANK
5.1%
UNEMPLOYMENT AMONG AGES 55 TO 59 YEARS
0.1/ 100
METRIC RATING
261st/ 347
METRIC RANK
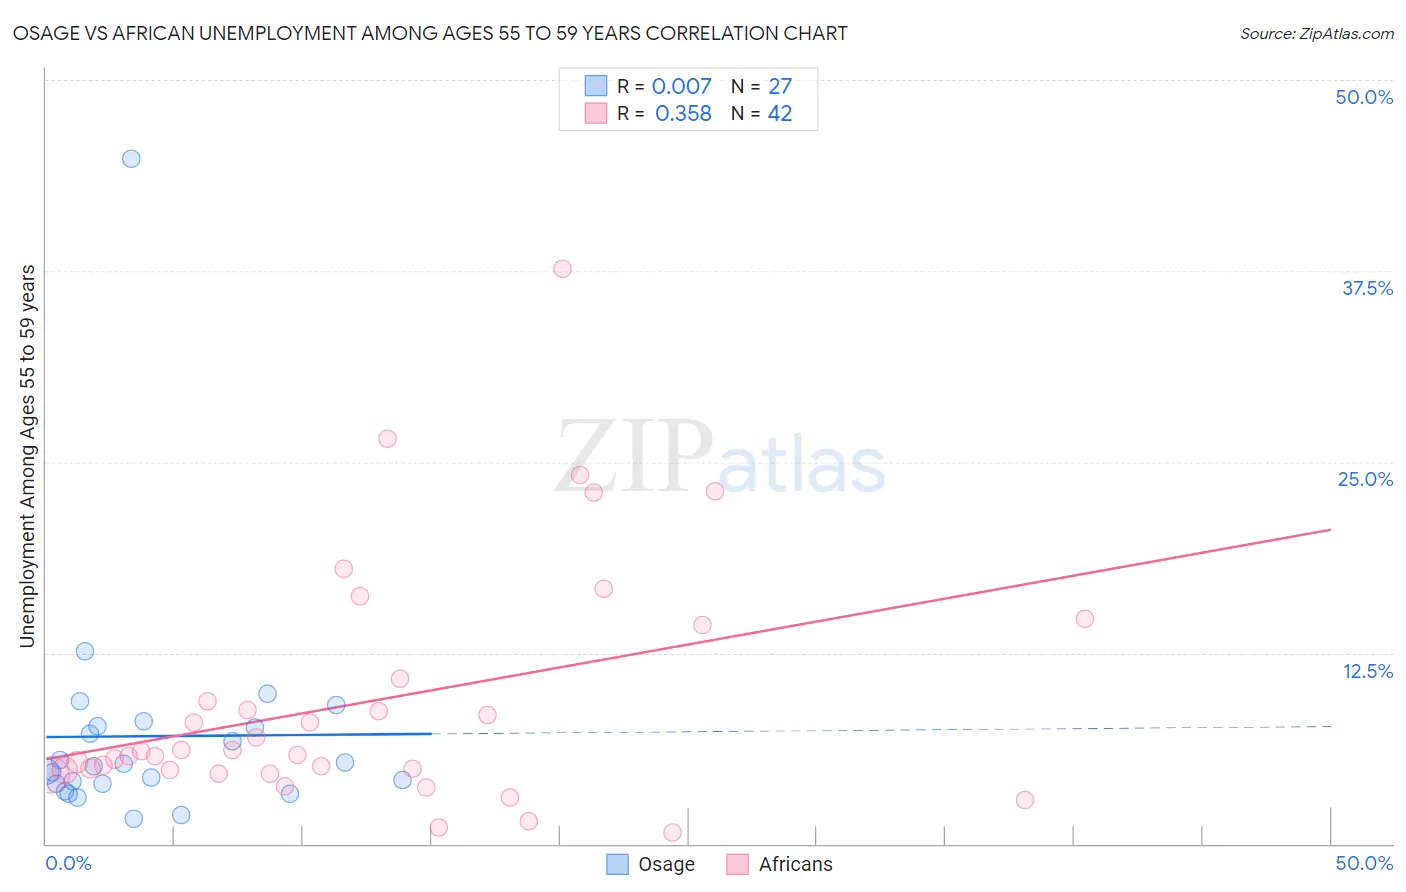
Osage vs African Unemployment Among Ages 55 to 59 years Correlation Chart
The statistical analysis conducted on geographies consisting of 89,169,253 people shows no correlation between the proportion of Osage and unemployment rate among population between the ages 55 and 59 in the United States with a correlation coefficient (R) of 0.007 and weighted average of 4.8%. Similarly, the statistical analysis conducted on geographies consisting of 427,769,430 people shows a mild positive correlation between the proportion of Africans and unemployment rate among population between the ages 55 and 59 in the United States with a correlation coefficient (R) of 0.358 and weighted average of 5.1%, a difference of 6.1%.
Unemployment Among Ages 55 to 59 years Correlation Summary
| Measurement | Osage | African |
| Minimum | 1.6% | 0.70% |
| Maximum | 44.8% | 37.6% |
| Range | 43.2% | 36.9% |
| Mean | 7.0% | 9.3% |
| Median | 5.1% | 5.9% |
| Interquartile 25% (IQ1) | 3.9% | 4.8% |
| Interquartile 75% (IQ3) | 7.7% | 10.8% |
| Interquartile Range (IQR) | 3.8% | 6.0% |
| Standard Deviation (Sample) | 8.0% | 7.9% |
| Standard Deviation (Population) | 7.8% | 7.8% |
Similar Demographics by Unemployment Among Ages 55 to 59 years
Demographics Similar to Osage by Unemployment Among Ages 55 to 59 years
In terms of unemployment among ages 55 to 59 years, the demographic groups most similar to Osage are Peruvian (4.8%, a difference of 0.0%), Immigrants from Morocco (4.8%, a difference of 0.020%), Immigrants from Czechoslovakia (4.8%, a difference of 0.040%), Immigrants from Eastern Asia (4.8%, a difference of 0.040%), and Immigrants from Peru (4.8%, a difference of 0.070%).
| Demographics | Rating | Rank | Unemployment Among Ages 55 to 59 years |
| Hungarians | 44.3 /100 | #179 | Average 4.8% |
| South Americans | 44.0 /100 | #180 | Average 4.8% |
| Immigrants | Hungary | 40.4 /100 | #181 | Average 4.8% |
| Immigrants | Europe | 40.4 /100 | #182 | Average 4.8% |
| Immigrants | Peru | 38.6 /100 | #183 | Fair 4.8% |
| Immigrants | Czechoslovakia | 38.0 /100 | #184 | Fair 4.8% |
| Peruvians | 37.0 /100 | #185 | Fair 4.8% |
| Osage | 37.0 /100 | #186 | Fair 4.8% |
| Immigrants | Morocco | 36.5 /100 | #187 | Fair 4.8% |
| Immigrants | Eastern Asia | 36.1 /100 | #188 | Fair 4.8% |
| Iroquois | 34.5 /100 | #189 | Fair 4.9% |
| Russians | 33.9 /100 | #190 | Fair 4.9% |
| Iranians | 32.4 /100 | #191 | Fair 4.9% |
| Immigrants | Ukraine | 31.7 /100 | #192 | Fair 4.9% |
| Immigrants | Italy | 30.1 /100 | #193 | Fair 4.9% |
Demographics Similar to Africans by Unemployment Among Ages 55 to 59 years
In terms of unemployment among ages 55 to 59 years, the demographic groups most similar to Africans are Immigrants from El Salvador (5.1%, a difference of 0.070%), Immigrants from Western Africa (5.1%, a difference of 0.11%), Immigrants from West Indies (5.1%, a difference of 0.21%), Immigrants from Sierra Leone (5.2%, a difference of 0.26%), and Salvadoran (5.1%, a difference of 0.30%).
| Demographics | Rating | Rank | Unemployment Among Ages 55 to 59 years |
| Seminole | 0.3 /100 | #254 | Tragic 5.1% |
| Blackfeet | 0.3 /100 | #255 | Tragic 5.1% |
| Senegalese | 0.3 /100 | #256 | Tragic 5.1% |
| Central Americans | 0.2 /100 | #257 | Tragic 5.1% |
| Salvadorans | 0.2 /100 | #258 | Tragic 5.1% |
| Immigrants | West Indies | 0.2 /100 | #259 | Tragic 5.1% |
| Immigrants | Western Africa | 0.2 /100 | #260 | Tragic 5.1% |
| Africans | 0.1 /100 | #261 | Tragic 5.1% |
| Immigrants | El Salvador | 0.1 /100 | #262 | Tragic 5.1% |
| Immigrants | Sierra Leone | 0.1 /100 | #263 | Tragic 5.2% |
| Immigrants | Caribbean | 0.1 /100 | #264 | Tragic 5.2% |
| Yaqui | 0.1 /100 | #265 | Tragic 5.2% |
| Jamaicans | 0.1 /100 | #266 | Tragic 5.2% |
| Immigrants | Senegal | 0.1 /100 | #267 | Tragic 5.2% |
| Mexicans | 0.1 /100 | #268 | Tragic 5.2% |