Norwegian vs Sioux Unemployment Among Ages 65 to 74 years
COMPARE
Norwegian
Sioux
Unemployment Among Ages 65 to 74 years
Unemployment Among Ages 65 to 74 years Comparison
Norwegians
Sioux
5.0%
UNEMPLOYMENT AMONG AGES 65 TO 74 YEARS
100.0/ 100
METRIC RATING
27th/ 347
METRIC RANK
5.1%
UNEMPLOYMENT AMONG AGES 65 TO 74 YEARS
99.8/ 100
METRIC RATING
45th/ 347
METRIC RANK
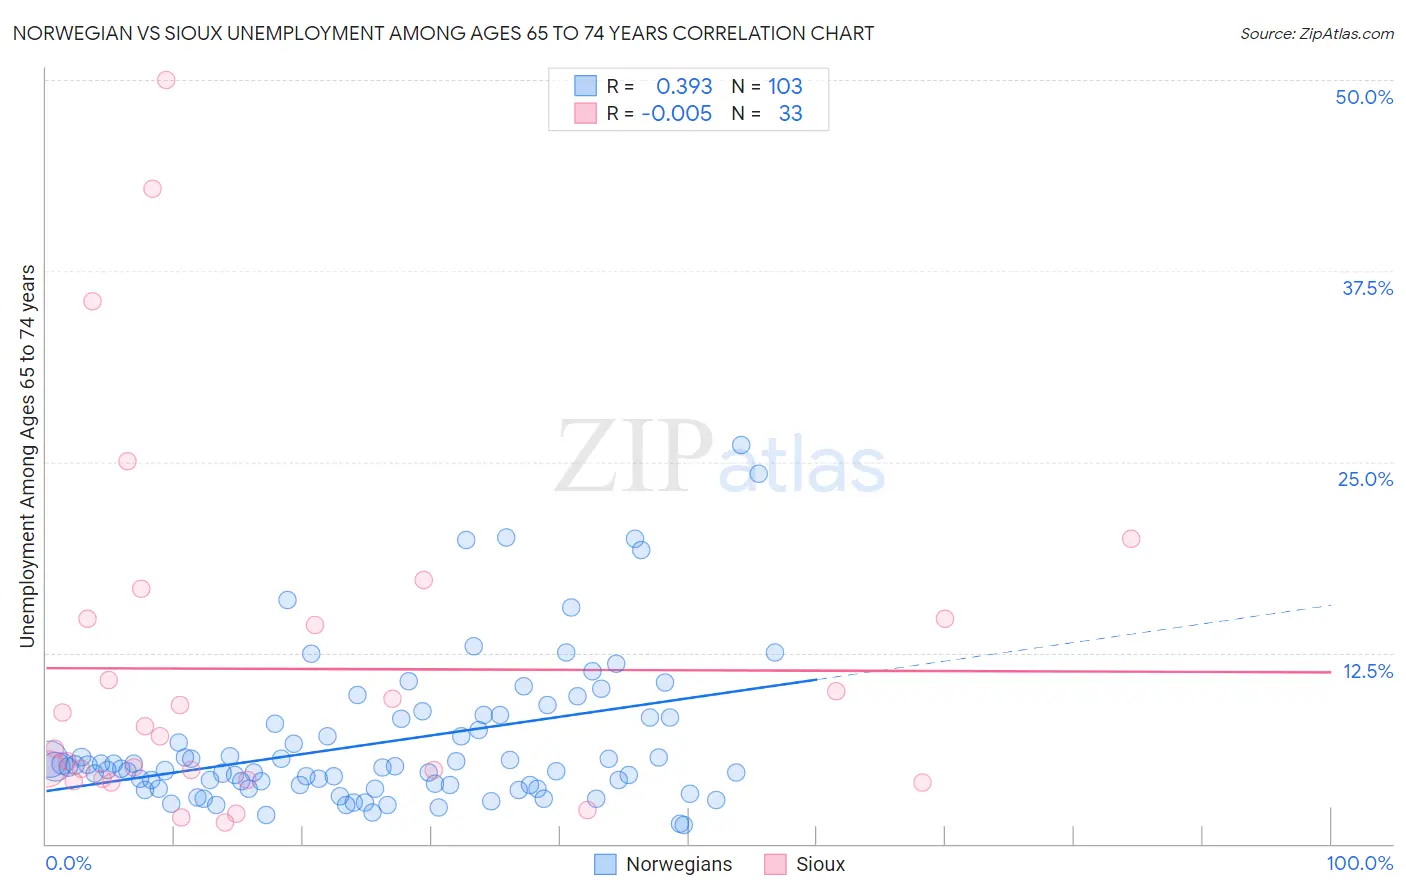
Norwegian vs Sioux Unemployment Among Ages 65 to 74 years Correlation Chart
The statistical analysis conducted on geographies consisting of 427,299,233 people shows a mild positive correlation between the proportion of Norwegians and unemployment rate among population between the ages 65 and 74 in the United States with a correlation coefficient (R) of 0.393 and weighted average of 5.0%. Similarly, the statistical analysis conducted on geographies consisting of 207,257,269 people shows no correlation between the proportion of Sioux and unemployment rate among population between the ages 65 and 74 in the United States with a correlation coefficient (R) of -0.005 and weighted average of 5.1%, a difference of 2.3%.
Unemployment Among Ages 65 to 74 years Correlation Summary
| Measurement | Norwegian | Sioux |
| Minimum | 1.2% | 1.4% |
| Maximum | 26.1% | 50.0% |
| Range | 24.9% | 48.6% |
| Mean | 6.6% | 11.4% |
| Median | 5.0% | 7.0% |
| Interquartile 25% (IQ1) | 3.8% | 4.2% |
| Interquartile 75% (IQ3) | 8.3% | 14.7% |
| Interquartile Range (IQR) | 4.4% | 10.5% |
| Standard Deviation (Sample) | 4.8% | 11.7% |
| Standard Deviation (Population) | 4.8% | 11.5% |
Demographics Similar to Norwegians and Sioux by Unemployment Among Ages 65 to 74 years
In terms of unemployment among ages 65 to 74 years, the demographic groups most similar to Norwegians are Bulgarian (5.0%, a difference of 0.10%), Czech (5.0%, a difference of 0.19%), Ethiopian (5.0%, a difference of 0.55%), Immigrants from Lebanon (5.0%, a difference of 0.64%), and Slovene (5.0%, a difference of 0.74%). Similarly, the demographic groups most similar to Sioux are Immigrants from India (5.1%, a difference of 0.11%), Immigrants from Kenya (5.1%, a difference of 0.14%), Assyrian/Chaldean/Syriac (5.1%, a difference of 0.20%), Jordanian (5.1%, a difference of 0.32%), and Ugandan (5.1%, a difference of 0.47%).
| Demographics | Rating | Rank | Unemployment Among Ages 65 to 74 years |
| Czechs | 100.0 /100 | #26 | Exceptional 5.0% |
| Norwegians | 100.0 /100 | #27 | Exceptional 5.0% |
| Bulgarians | 100.0 /100 | #28 | Exceptional 5.0% |
| Ethiopians | 100.0 /100 | #29 | Exceptional 5.0% |
| Immigrants | Lebanon | 100.0 /100 | #30 | Exceptional 5.0% |
| Slovenes | 100.0 /100 | #31 | Exceptional 5.0% |
| Palestinians | 100.0 /100 | #32 | Exceptional 5.0% |
| Belgians | 100.0 /100 | #33 | Exceptional 5.0% |
| Cambodians | 100.0 /100 | #34 | Exceptional 5.0% |
| Bhutanese | 100.0 /100 | #35 | Exceptional 5.0% |
| Immigrants | Kuwait | 99.9 /100 | #36 | Exceptional 5.0% |
| Immigrants | Eastern Africa | 99.9 /100 | #37 | Exceptional 5.0% |
| Nepalese | 99.9 /100 | #38 | Exceptional 5.0% |
| Immigrants | Sweden | 99.9 /100 | #39 | Exceptional 5.0% |
| Immigrants | Iraq | 99.9 /100 | #40 | Exceptional 5.1% |
| Ugandans | 99.9 /100 | #41 | Exceptional 5.1% |
| Jordanians | 99.9 /100 | #42 | Exceptional 5.1% |
| Assyrians/Chaldeans/Syriacs | 99.9 /100 | #43 | Exceptional 5.1% |
| Immigrants | India | 99.9 /100 | #44 | Exceptional 5.1% |
| Sioux | 99.8 /100 | #45 | Exceptional 5.1% |
| Immigrants | Kenya | 99.8 /100 | #46 | Exceptional 5.1% |