Northern European vs Ugandan Unemployment Among Women with Children Under 18 years
COMPARE
Northern European
Ugandan
Unemployment Among Women with Children Under 18 years
Unemployment Among Women with Children Under 18 years Comparison
Northern Europeans
Ugandans
5.0%
UNEMPLOYMENT AMONG WOMEN WITH CHILDREN UNDER 18 YEARS
98.6/ 100
METRIC RATING
48th/ 347
METRIC RANK
5.9%
UNEMPLOYMENT AMONG WOMEN WITH CHILDREN UNDER 18 YEARS
1.1/ 100
METRIC RATING
245th/ 347
METRIC RANK
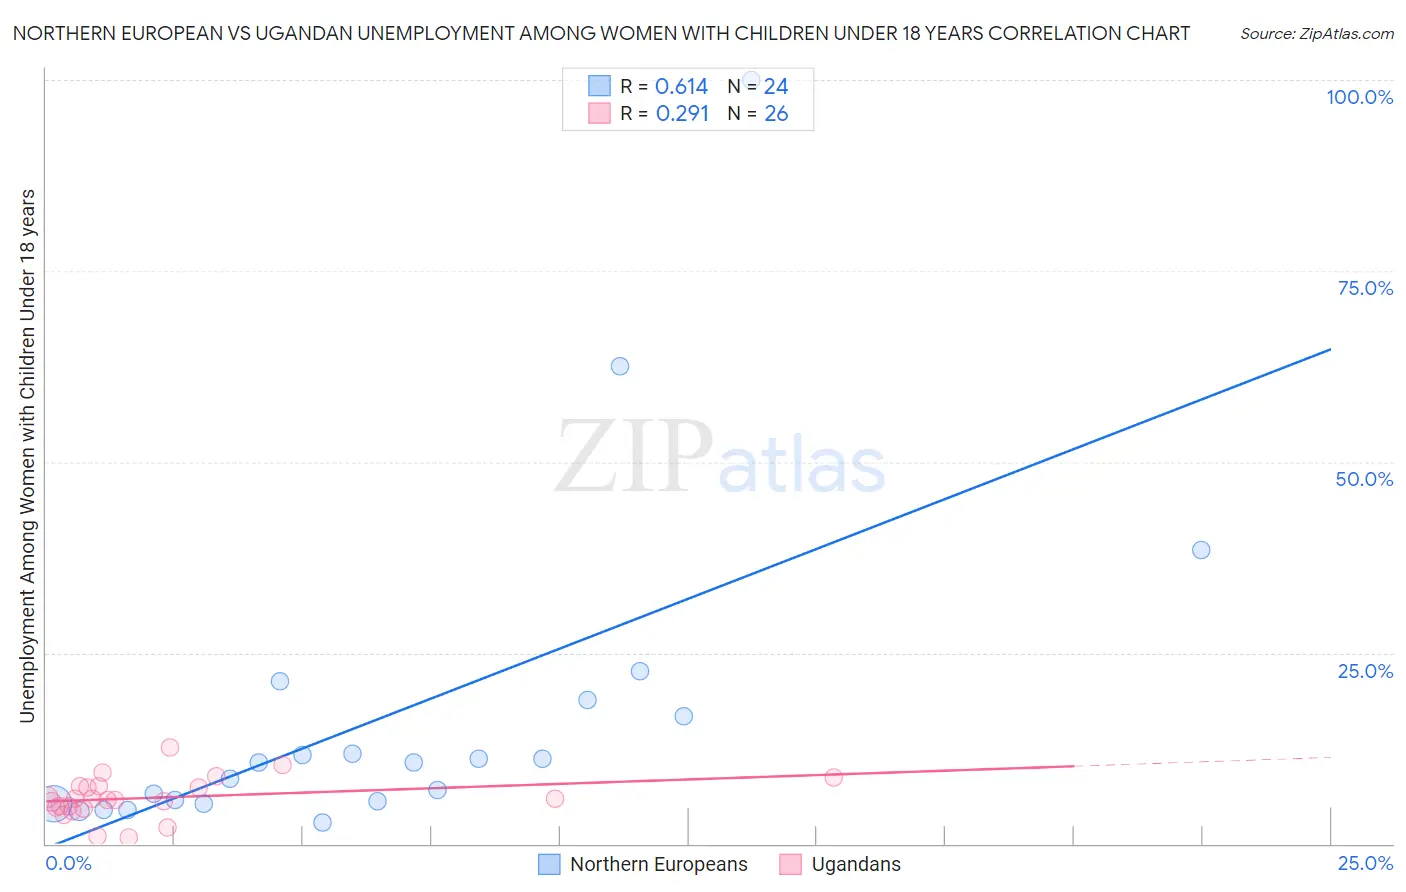
Northern European vs Ugandan Unemployment Among Women with Children Under 18 years Correlation Chart
The statistical analysis conducted on geographies consisting of 384,114,804 people shows a significant positive correlation between the proportion of Northern Europeans and unemployment rate among women with children under the age of 18 in the United States with a correlation coefficient (R) of 0.614 and weighted average of 5.0%. Similarly, the statistical analysis conducted on geographies consisting of 93,232,575 people shows a weak positive correlation between the proportion of Ugandans and unemployment rate among women with children under the age of 18 in the United States with a correlation coefficient (R) of 0.291 and weighted average of 5.9%, a difference of 16.8%.
Unemployment Among Women with Children Under 18 years Correlation Summary
| Measurement | Northern European | Ugandan |
| Minimum | 2.7% | 0.90% |
| Maximum | 100.0% | 12.6% |
| Range | 97.3% | 11.7% |
| Mean | 17.0% | 6.0% |
| Median | 10.7% | 5.8% |
| Interquartile 25% (IQ1) | 5.4% | 4.8% |
| Interquartile 75% (IQ3) | 17.7% | 7.6% |
| Interquartile Range (IQR) | 12.3% | 2.8% |
| Standard Deviation (Sample) | 22.0% | 2.7% |
| Standard Deviation (Population) | 21.6% | 2.6% |
Similar Demographics by Unemployment Among Women with Children Under 18 years
Demographics Similar to Northern Europeans by Unemployment Among Women with Children Under 18 years
In terms of unemployment among women with children under 18 years, the demographic groups most similar to Northern Europeans are British (5.0%, a difference of 0.13%), Lithuanian (5.0%, a difference of 0.22%), Immigrants from Korea (5.0%, a difference of 0.25%), Immigrants from Japan (5.0%, a difference of 0.25%), and Yugoslavian (5.1%, a difference of 0.33%).
| Demographics | Rating | Rank | Unemployment Among Women with Children Under 18 years |
| Immigrants | Bosnia and Herzegovina | 99.0 /100 | #41 | Exceptional 5.0% |
| Eastern Europeans | 98.9 /100 | #42 | Exceptional 5.0% |
| Turks | 98.9 /100 | #43 | Exceptional 5.0% |
| Immigrants | Moldova | 98.9 /100 | #44 | Exceptional 5.0% |
| Immigrants | Malaysia | 98.8 /100 | #45 | Exceptional 5.0% |
| Immigrants | Korea | 98.7 /100 | #46 | Exceptional 5.0% |
| British | 98.7 /100 | #47 | Exceptional 5.0% |
| Northern Europeans | 98.6 /100 | #48 | Exceptional 5.0% |
| Lithuanians | 98.4 /100 | #49 | Exceptional 5.0% |
| Immigrants | Japan | 98.4 /100 | #50 | Exceptional 5.0% |
| Yugoslavians | 98.3 /100 | #51 | Exceptional 5.1% |
| Immigrants | Nepal | 98.3 /100 | #52 | Exceptional 5.1% |
| Scottish | 98.2 /100 | #53 | Exceptional 5.1% |
| Immigrants | Serbia | 98.2 /100 | #54 | Exceptional 5.1% |
| Immigrants | Sri Lanka | 98.1 /100 | #55 | Exceptional 5.1% |
Demographics Similar to Ugandans by Unemployment Among Women with Children Under 18 years
In terms of unemployment among women with children under 18 years, the demographic groups most similar to Ugandans are Choctaw (5.9%, a difference of 0.040%), Immigrants from Uruguay (5.9%, a difference of 0.090%), Uruguayan (5.9%, a difference of 0.13%), Cape Verdean (5.9%, a difference of 0.21%), and Moroccan (5.9%, a difference of 0.38%).
| Demographics | Rating | Rank | Unemployment Among Women with Children Under 18 years |
| Immigrants | Somalia | 2.2 /100 | #238 | Tragic 5.8% |
| Immigrants | Sierra Leone | 2.0 /100 | #239 | Tragic 5.8% |
| Immigrants | Immigrants | 2.0 /100 | #240 | Tragic 5.8% |
| Brazilians | 1.6 /100 | #241 | Tragic 5.8% |
| Moroccans | 1.4 /100 | #242 | Tragic 5.9% |
| Immigrants | Uruguay | 1.1 /100 | #243 | Tragic 5.9% |
| Choctaw | 1.1 /100 | #244 | Tragic 5.9% |
| Ugandans | 1.1 /100 | #245 | Tragic 5.9% |
| Uruguayans | 1.0 /100 | #246 | Tragic 5.9% |
| Cape Verdeans | 1.0 /100 | #247 | Tragic 5.9% |
| Delaware | 0.8 /100 | #248 | Tragic 5.9% |
| Immigrants | Cameroon | 0.8 /100 | #249 | Tragic 5.9% |
| Immigrants | Cabo Verde | 0.7 /100 | #250 | Tragic 5.9% |
| Ute | 0.7 /100 | #251 | Tragic 5.9% |
| Seminole | 0.5 /100 | #252 | Tragic 6.0% |