Northern European vs Dominican Unemployment Among Ages 55 to 59 years
COMPARE
Northern European
Dominican
Unemployment Among Ages 55 to 59 years
Unemployment Among Ages 55 to 59 years Comparison
Northern Europeans
Dominicans
4.5%
UNEMPLOYMENT AMONG AGES 55 TO 59 YEARS
99.6/ 100
METRIC RATING
57th/ 347
METRIC RANK
6.2%
UNEMPLOYMENT AMONG AGES 55 TO 59 YEARS
0.0/ 100
METRIC RATING
329th/ 347
METRIC RANK
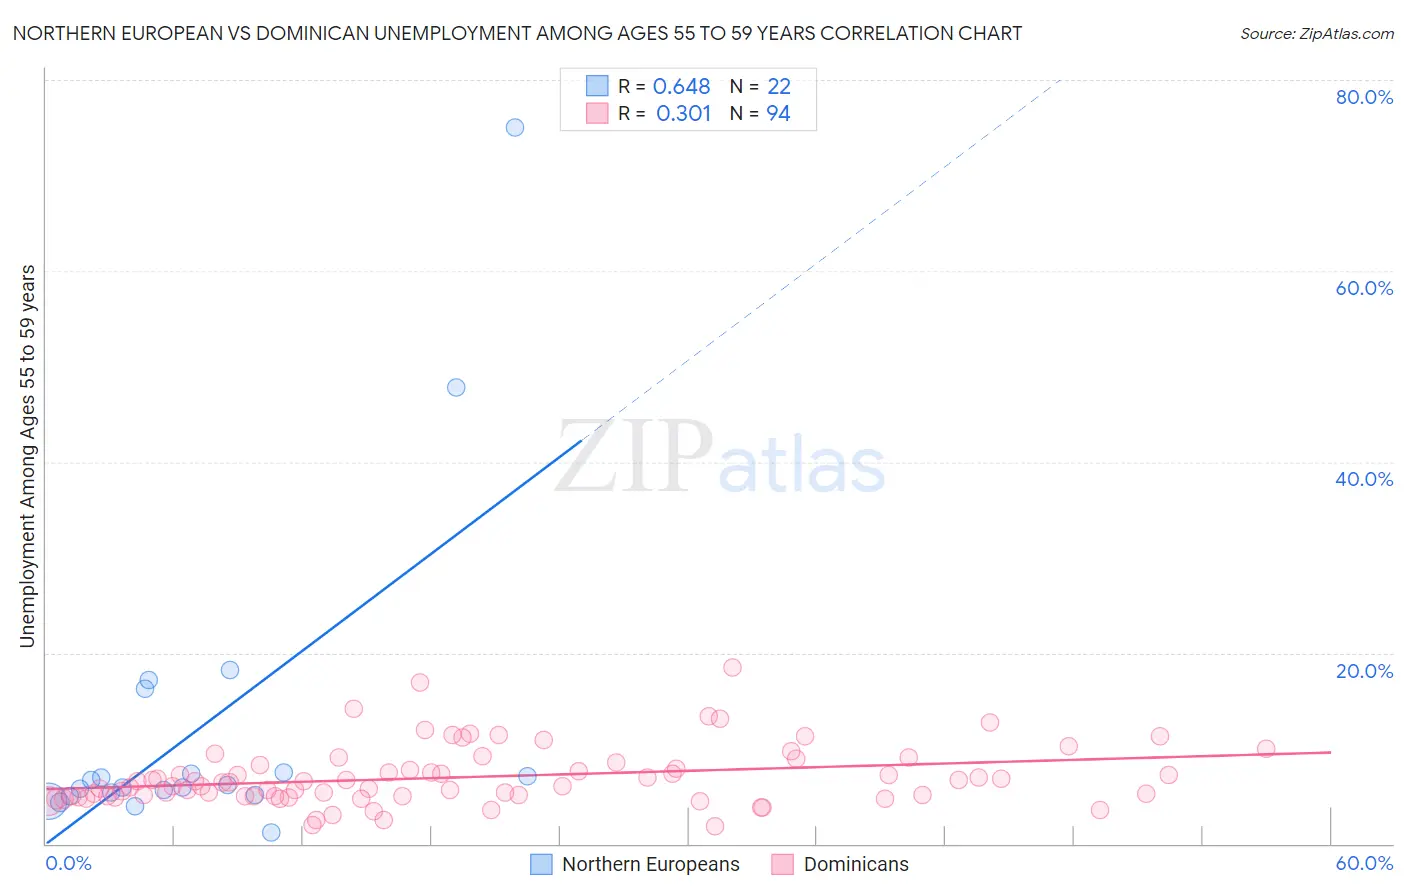
Northern European vs Dominican Unemployment Among Ages 55 to 59 years Correlation Chart
The statistical analysis conducted on geographies consisting of 371,257,801 people shows a significant positive correlation between the proportion of Northern Europeans and unemployment rate among population between the ages 55 and 59 in the United States with a correlation coefficient (R) of 0.648 and weighted average of 4.5%. Similarly, the statistical analysis conducted on geographies consisting of 332,937,013 people shows a mild positive correlation between the proportion of Dominicans and unemployment rate among population between the ages 55 and 59 in the United States with a correlation coefficient (R) of 0.301 and weighted average of 6.2%, a difference of 36.8%.
Unemployment Among Ages 55 to 59 years Correlation Summary
| Measurement | Northern European | Dominican |
| Minimum | 1.2% | 1.8% |
| Maximum | 75.0% | 18.5% |
| Range | 73.8% | 16.7% |
| Mean | 12.2% | 7.0% |
| Median | 6.0% | 6.2% |
| Interquartile 25% (IQ1) | 5.2% | 5.0% |
| Interquartile 75% (IQ3) | 7.4% | 8.3% |
| Interquartile Range (IQR) | 2.2% | 3.3% |
| Standard Deviation (Sample) | 17.0% | 3.1% |
| Standard Deviation (Population) | 16.6% | 3.1% |
Similar Demographics by Unemployment Among Ages 55 to 59 years
Demographics Similar to Northern Europeans by Unemployment Among Ages 55 to 59 years
In terms of unemployment among ages 55 to 59 years, the demographic groups most similar to Northern Europeans are Welsh (4.5%, a difference of 0.010%), Okinawan (4.5%, a difference of 0.020%), Immigrants from Nepal (4.5%, a difference of 0.060%), Scottish (4.5%, a difference of 0.16%), and Immigrants from Middle Africa (4.5%, a difference of 0.16%).
| Demographics | Rating | Rank | Unemployment Among Ages 55 to 59 years |
| Immigrants | Pakistan | 99.7 /100 | #50 | Exceptional 4.5% |
| Maltese | 99.7 /100 | #51 | Exceptional 4.5% |
| Scottish | 99.7 /100 | #52 | Exceptional 4.5% |
| Immigrants | Middle Africa | 99.7 /100 | #53 | Exceptional 4.5% |
| Burmese | 99.7 /100 | #54 | Exceptional 4.5% |
| Immigrants | Nepal | 99.6 /100 | #55 | Exceptional 4.5% |
| Welsh | 99.6 /100 | #56 | Exceptional 4.5% |
| Northern Europeans | 99.6 /100 | #57 | Exceptional 4.5% |
| Okinawans | 99.6 /100 | #58 | Exceptional 4.5% |
| Immigrants | Uganda | 99.5 /100 | #59 | Exceptional 4.6% |
| Dutch | 99.5 /100 | #60 | Exceptional 4.6% |
| Immigrants | Argentina | 99.5 /100 | #61 | Exceptional 4.6% |
| Slovenes | 99.3 /100 | #62 | Exceptional 4.6% |
| Immigrants | South Central Asia | 99.3 /100 | #63 | Exceptional 4.6% |
| Argentineans | 99.1 /100 | #64 | Exceptional 4.6% |
Demographics Similar to Dominicans by Unemployment Among Ages 55 to 59 years
In terms of unemployment among ages 55 to 59 years, the demographic groups most similar to Dominicans are Alaska Native (6.2%, a difference of 0.43%), Immigrants from Dominican Republic (6.3%, a difference of 1.1%), Yuman (6.1%, a difference of 1.4%), Arapaho (6.1%, a difference of 2.6%), and Native/Alaskan (6.0%, a difference of 3.5%).
| Demographics | Rating | Rank | Unemployment Among Ages 55 to 59 years |
| Crow | 0.0 /100 | #322 | Tragic 5.9% |
| Immigrants | Bangladesh | 0.0 /100 | #323 | Tragic 5.9% |
| Vietnamese | 0.0 /100 | #324 | Tragic 5.9% |
| Immigrants | Armenia | 0.0 /100 | #325 | Tragic 6.0% |
| Natives/Alaskans | 0.0 /100 | #326 | Tragic 6.0% |
| Arapaho | 0.0 /100 | #327 | Tragic 6.1% |
| Yuman | 0.0 /100 | #328 | Tragic 6.1% |
| Dominicans | 0.0 /100 | #329 | Tragic 6.2% |
| Alaska Natives | 0.0 /100 | #330 | Tragic 6.2% |
| Immigrants | Dominican Republic | 0.0 /100 | #331 | Tragic 6.3% |
| Aleuts | 0.0 /100 | #332 | Tragic 6.4% |
| Pima | 0.0 /100 | #333 | Tragic 6.6% |
| Pueblo | 0.0 /100 | #334 | Tragic 6.7% |
| Colville | 0.0 /100 | #335 | Tragic 6.7% |
| Navajo | 0.0 /100 | #336 | Tragic 6.7% |