Nonimmigrants vs Immigrants from Morocco Unemployment Among Seniors over 75 years
COMPARE
Nonimmigrants
Immigrants from Morocco
Unemployment Among Seniors over 75 years
Unemployment Among Seniors over 75 years Comparison
Nonimmigrants
Immigrants from Morocco
9.8%
UNEMPLOYMENT AMONG SENIORS OVER 75 YEARS
0.0/ 100
METRIC RATING
295th/ 347
METRIC RANK
7.9%
UNEMPLOYMENT AMONG SENIORS OVER 75 YEARS
99.9/ 100
METRIC RATING
60th/ 347
METRIC RANK
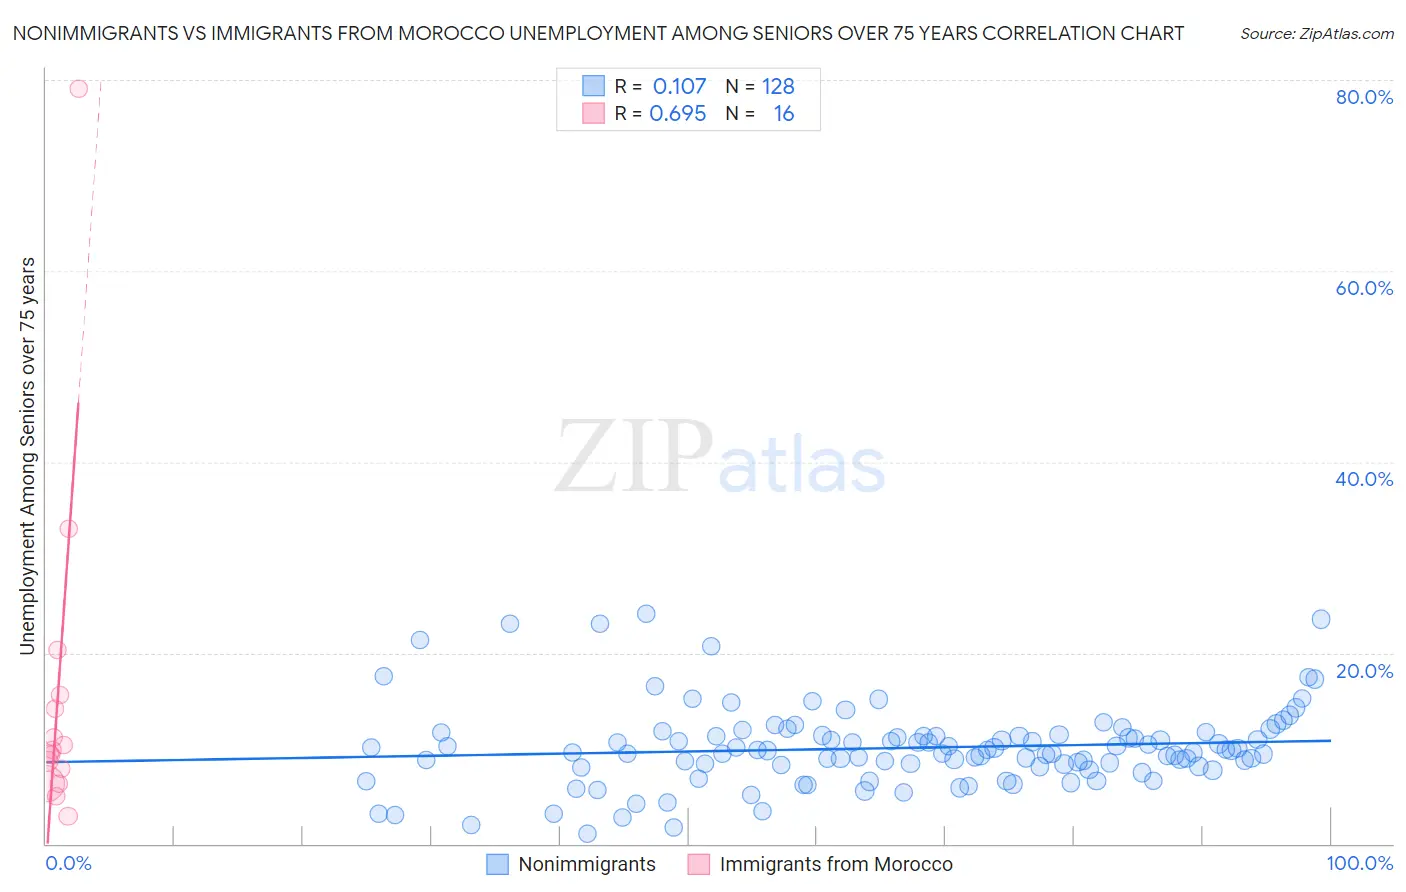
Nonimmigrants vs Immigrants from Morocco Unemployment Among Seniors over 75 years Correlation Chart
The statistical analysis conducted on geographies consisting of 234,788,716 people shows a poor positive correlation between the proportion of Nonimmigrants and unemployment rate among seniors over the age of 75 in the United States with a correlation coefficient (R) of 0.107 and weighted average of 9.8%. Similarly, the statistical analysis conducted on geographies consisting of 119,157,817 people shows a significant positive correlation between the proportion of Immigrants from Morocco and unemployment rate among seniors over the age of 75 in the United States with a correlation coefficient (R) of 0.695 and weighted average of 7.9%, a difference of 24.2%.
Unemployment Among Seniors over 75 years Correlation Summary
| Measurement | Nonimmigrants | Immigrants from Morocco |
| Minimum | 1.1% | 2.9% |
| Maximum | 24.1% | 79.1% |
| Range | 23.0% | 76.2% |
| Mean | 10.0% | 15.5% |
| Median | 9.7% | 9.6% |
| Interquartile 25% (IQ1) | 8.1% | 7.1% |
| Interquartile 75% (IQ3) | 11.3% | 14.8% |
| Interquartile Range (IQR) | 3.2% | 7.8% |
| Standard Deviation (Sample) | 4.2% | 18.4% |
| Standard Deviation (Population) | 4.2% | 17.8% |
Similar Demographics by Unemployment Among Seniors over 75 years
Demographics Similar to Nonimmigrants by Unemployment Among Seniors over 75 years
In terms of unemployment among seniors over 75 years, the demographic groups most similar to Nonimmigrants are Immigrants from St. Vincent and the Grenadines (9.8%, a difference of 0.050%), Cherokee (9.8%, a difference of 0.13%), Immigrants from Dominica (9.8%, a difference of 0.36%), Norwegian (9.8%, a difference of 0.42%), and Lithuanian (9.9%, a difference of 0.51%).
| Demographics | Rating | Rank | Unemployment Among Seniors over 75 years |
| Canadians | 0.0 /100 | #288 | Tragic 9.7% |
| Czechs | 0.0 /100 | #289 | Tragic 9.7% |
| Sioux | 0.0 /100 | #290 | Tragic 9.7% |
| Scandinavians | 0.0 /100 | #291 | Tragic 9.7% |
| Immigrants | Western Africa | 0.0 /100 | #292 | Tragic 9.8% |
| Norwegians | 0.0 /100 | #293 | Tragic 9.8% |
| Immigrants | Dominica | 0.0 /100 | #294 | Tragic 9.8% |
| Immigrants | Nonimmigrants | 0.0 /100 | #295 | Tragic 9.8% |
| Immigrants | St. Vincent and the Grenadines | 0.0 /100 | #296 | Tragic 9.8% |
| Cherokee | 0.0 /100 | #297 | Tragic 9.8% |
| Lithuanians | 0.0 /100 | #298 | Tragic 9.9% |
| Belgians | 0.0 /100 | #299 | Tragic 9.9% |
| Iraqis | 0.0 /100 | #300 | Tragic 9.9% |
| Welsh | 0.0 /100 | #301 | Tragic 10.0% |
| Finns | 0.0 /100 | #302 | Tragic 10.0% |
Demographics Similar to Immigrants from Morocco by Unemployment Among Seniors over 75 years
In terms of unemployment among seniors over 75 years, the demographic groups most similar to Immigrants from Morocco are Uruguayan (7.9%, a difference of 0.040%), Indonesian (7.9%, a difference of 0.050%), Immigrants from Albania (7.9%, a difference of 0.060%), Immigrants from Nicaragua (7.9%, a difference of 0.14%), and Immigrants from Taiwan (7.9%, a difference of 0.20%).
| Demographics | Rating | Rank | Unemployment Among Seniors over 75 years |
| Immigrants | Egypt | 100.0 /100 | #53 | Exceptional 7.9% |
| Immigrants | Malaysia | 99.9 /100 | #54 | Exceptional 7.9% |
| Filipinos | 99.9 /100 | #55 | Exceptional 7.9% |
| Immigrants | Eastern Asia | 99.9 /100 | #56 | Exceptional 7.9% |
| Ottawa | 99.9 /100 | #57 | Exceptional 7.9% |
| Iranians | 99.9 /100 | #58 | Exceptional 7.9% |
| Indonesians | 99.9 /100 | #59 | Exceptional 7.9% |
| Immigrants | Morocco | 99.9 /100 | #60 | Exceptional 7.9% |
| Uruguayans | 99.9 /100 | #61 | Exceptional 7.9% |
| Immigrants | Albania | 99.9 /100 | #62 | Exceptional 7.9% |
| Immigrants | Nicaragua | 99.9 /100 | #63 | Exceptional 7.9% |
| Immigrants | Taiwan | 99.9 /100 | #64 | Exceptional 7.9% |
| Argentineans | 99.9 /100 | #65 | Exceptional 7.9% |
| Immigrants | Austria | 99.9 /100 | #66 | Exceptional 8.0% |
| Immigrants | Syria | 99.9 /100 | #67 | Exceptional 8.0% |