Nonimmigrants vs Immigrants from Ethiopia Unemployment Among Women with Children Under 18 years

COMPARE

Nonimmigrants
Race
Ancestry
AfghanAfricanAlaska NativeAlaskan AthabascanAlbanianAleutAlsatianAmericanApacheArabArapahoArgentineanArmenianAssyrian/Chaldean/SyriacAustralianAustrianBahamianBangladeshiBarbadianBasqueBelgianBelizeanBermudanBhutaneseBlackfeetBolivianBrazilianBritishBritish West IndianBulgarianBurmeseCajunCambodianCanadianCape VerdeanCarpatho RusynCelticCentral AmericanCentral American IndianCherokeeCheyenneChickasawChileanChineseChippewaChoctawColombianColvilleComancheCosta RicanCreeCreekCroatianCrowCubanCypriotCzechCzechoslovakianDanishDelawareDominicanDutchDutch West IndianEastern EuropeanEcuadorianEgyptianEnglishEstonianEthiopianEuropeanFijianFilipinoFinnishFrenchFrench American IndianFrench CanadianGermanGerman RussianGhanaianGreekGuamanian/ChamorroGuatemalanGuyaneseHaitianHmongHonduranHopiHoumaHungarianIcelanderIndian (Asian)IndonesianInupiatIranianIraqiIrishIroquoisIsraeliItalianJamaicanJapaneseJordanianKenyanKiowaKoreanLaotianLatvianLebaneseLiberianLithuanianLumbeeLuxembourgerMacedonianMalaysianMalteseMarshalleseMenomineeMexicanMexican American IndianMongolianMoroccanNative HawaiianNavajoNepaleseNew ZealanderNicaraguanNigerianNorthern EuropeanNorwegianOkinawanOsageOttawaPaiutePakistaniPalestinianPanamanianParaguayanPennsylvania GermanPeruvianPimaPolishPortuguesePotawatomiPuebloPuerto RicanPuget Sound SalishRomanianRussianSalvadoranSamoanScandinavianScotch-IrishScottishSeminoleSenegaleseSerbianShoshoneSierra LeoneanSiouxSlavicSlovakSloveneSomaliSouth AfricanSouth AmericanSouth American IndianSoviet UnionSpaniardSpanishSpanish AmericanSpanish American IndianSri LankanSubsaharan AfricanSudaneseSwedishSwissSyrianTaiwaneseThaiTlingit-HaidaTohono O'OdhamTonganTrinidadian and TobagonianTsimshianTurkishU.S. Virgin IslanderUgandanUkrainianUruguayanUteVenezuelanVietnameseWelshWest IndianYakamaYaquiYugoslavianYumanYup'ikZimbabwean
Immigration
NonimmigrantsImmigrantsAfghanistanAfricaAlbaniaArgentinaArmeniaAsiaAustraliaAustriaBahamasBangladeshBarbadosBelarusBelgiumBelizeBoliviaBosnia and HerzegovinaBrazilBulgariaBurma/MyanmarCabo VerdeCambodiaCameroonCanadaCaribbeanCentral AmericaChileChinaColombiaCongoCosta RicaCroatiaCubaCzechoslovakiaDenmarkDominicaDominican RepublicEastern AfricaEastern AsiaEastern EuropeEcuadorEgyptEl SalvadorEnglandEritreaEuropeFijiFranceGermanyGhanaGreeceGrenadaGuatemalaGuyanaHaitiHondurasHong KongHungaryIndiaIndonesiaIranIraqIrelandIsraelItalyJamaicaJapanJordanKazakhstanKenyaKoreaKuwaitLaosLatin AmericaLatviaLebanonLiberiaLithuaniaMalaysiaMexicoMicronesiaMiddle AfricaMoldovaMoroccoNepalNetherlandsNicaraguaNigeriaNorth AmericaNorth MacedoniaNorthern AfricaNorthern EuropeNorwayOceaniaPakistanPanamaPeruPhilippinesPolandPortugalRomaniaRussiaSaudi ArabiaScotlandSenegalSerbiaSierra LeoneSingaporeSomaliaSouth AfricaSouth AmericaSouth Central AsiaSouth Eastern AsiaSouthern EuropeSpainSri LankaSt. Vincent and the GrenadinesSudanSwedenSwitzerlandSyriaTaiwanThailandTrinidad and TobagoTurkeyUgandaUkraineUruguayUzbekistanVenezuelaVietnamWest IndiesWestern AfricaWestern AsiaWestern EuropeYemenZaireZimbabweAzores
Immigrants from Ethiopia
Race
Ancestry
AfghanAfricanAlaska NativeAlaskan AthabascanAlbanianAleutAlsatianAmericanApacheArabArapahoArgentineanArmenianAssyrian/Chaldean/SyriacAustralianAustrianBahamianBangladeshiBarbadianBasqueBelgianBelizeanBermudanBhutaneseBlackfeetBolivianBrazilianBritishBritish West IndianBulgarianBurmeseCajunCambodianCanadianCape VerdeanCarpatho RusynCelticCentral AmericanCentral American IndianCherokeeCheyenneChickasawChileanChineseChippewaChoctawColombianColvilleComancheCosta RicanCreeCreekCroatianCrowCubanCypriotCzechCzechoslovakianDanishDelawareDominicanDutchDutch West IndianEastern EuropeanEcuadorianEgyptianEnglishEstonianEthiopianEuropeanFijianFilipinoFinnishFrenchFrench American IndianFrench CanadianGermanGerman RussianGhanaianGreekGuamanian/ChamorroGuatemalanGuyaneseHaitianHmongHonduranHopiHoumaHungarianIcelanderIndian (Asian)IndonesianInupiatIranianIraqiIrishIroquoisIsraeliItalianJamaicanJapaneseJordanianKenyanKiowaKoreanLaotianLatvianLebaneseLiberianLithuanianLumbeeLuxembourgerMacedonianMalaysianMalteseMarshalleseMenomineeMexicanMexican American IndianMongolianMoroccanNative HawaiianNavajoNepaleseNew ZealanderNicaraguanNigerianNorthern EuropeanNorwegianOkinawanOsageOttawaPaiutePakistaniPalestinianPanamanianParaguayanPennsylvania GermanPeruvianPimaPolishPortuguesePotawatomiPuebloPuerto RicanPuget Sound SalishRomanianRussianSalvadoranSamoanScandinavianScotch-IrishScottishSeminoleSenegaleseSerbianShoshoneSierra LeoneanSiouxSlavicSlovakSloveneSomaliSouth AfricanSouth AmericanSouth American IndianSoviet UnionSpaniardSpanishSpanish AmericanSpanish American IndianSri LankanSubsaharan AfricanSudaneseSwedishSwissSyrianTaiwaneseThaiTlingit-HaidaTohono O'OdhamTonganTrinidadian and TobagonianTsimshianTurkishU.S. Virgin IslanderUgandanUkrainianUruguayanUteVenezuelanVietnameseWelshWest IndianYakamaYaquiYugoslavianYumanYup'ikZimbabwean
Immigration
ImmigrantsAfghanistanAfricaAlbaniaArgentinaArmeniaAsiaAustraliaAustriaBahamasBangladeshBarbadosBelarusBelgiumBelizeBoliviaBosnia and HerzegovinaBrazilBulgariaBurma/MyanmarCabo VerdeCambodiaCameroonCanadaCaribbeanCentral AmericaChileChinaColombiaCongoCosta RicaCroatiaCubaCzechoslovakiaDenmarkDominicaDominican RepublicEastern AfricaEastern AsiaEastern EuropeEcuadorEgyptEl SalvadorEnglandEritreaEthiopiaEuropeFijiFranceGermanyGhanaGreeceGrenadaGuatemalaGuyanaHaitiHondurasHong KongHungaryIndiaIndonesiaIranIraqIrelandIsraelItalyJamaicaJapanJordanKazakhstanKenyaKoreaKuwaitLaosLatin AmericaLatviaLebanonLiberiaLithuaniaMalaysiaMexicoMicronesiaMiddle AfricaMoldovaMoroccoNepalNetherlandsNicaraguaNigeriaNorth AmericaNorth MacedoniaNorthern AfricaNorthern EuropeNorwayOceaniaPakistanPanamaPeruPhilippinesPolandPortugalRomaniaRussiaSaudi ArabiaScotlandSenegalSerbiaSierra LeoneSingaporeSomaliaSouth AfricaSouth AmericaSouth Central AsiaSouth Eastern AsiaSouthern EuropeSpainSri LankaSt. Vincent and the GrenadinesSudanSwedenSwitzerlandSyriaTaiwanThailandTrinidad and TobagoTurkeyUgandaUkraineUruguayUzbekistanVenezuelaVietnamWest IndiesWestern AfricaWestern AsiaWestern EuropeYemenZaireZimbabweAzores
Unemployment Among Women with Children Under 18 years
Income
Poverty
Unemployment
Labor Participation
Family Structure
Vehicle Availability
Education Level
Disability

Unemployment Among Women with Children Under 18 years Comparison

Nonimmigrants

Immigrants from Ethiopia

Poor
Excellent
5.7%
UNEMPLOYMENT AMONG WOMEN WITH CHILDREN UNDER 18 YEARS
10.6/ 100
METRIC RATING
210th/ 347
METRIC RANK
5.3%
UNEMPLOYMENT AMONG WOMEN WITH CHILDREN UNDER 18 YEARS
81.4/ 100
METRIC RATING
132nd/ 347
METRIC RANK

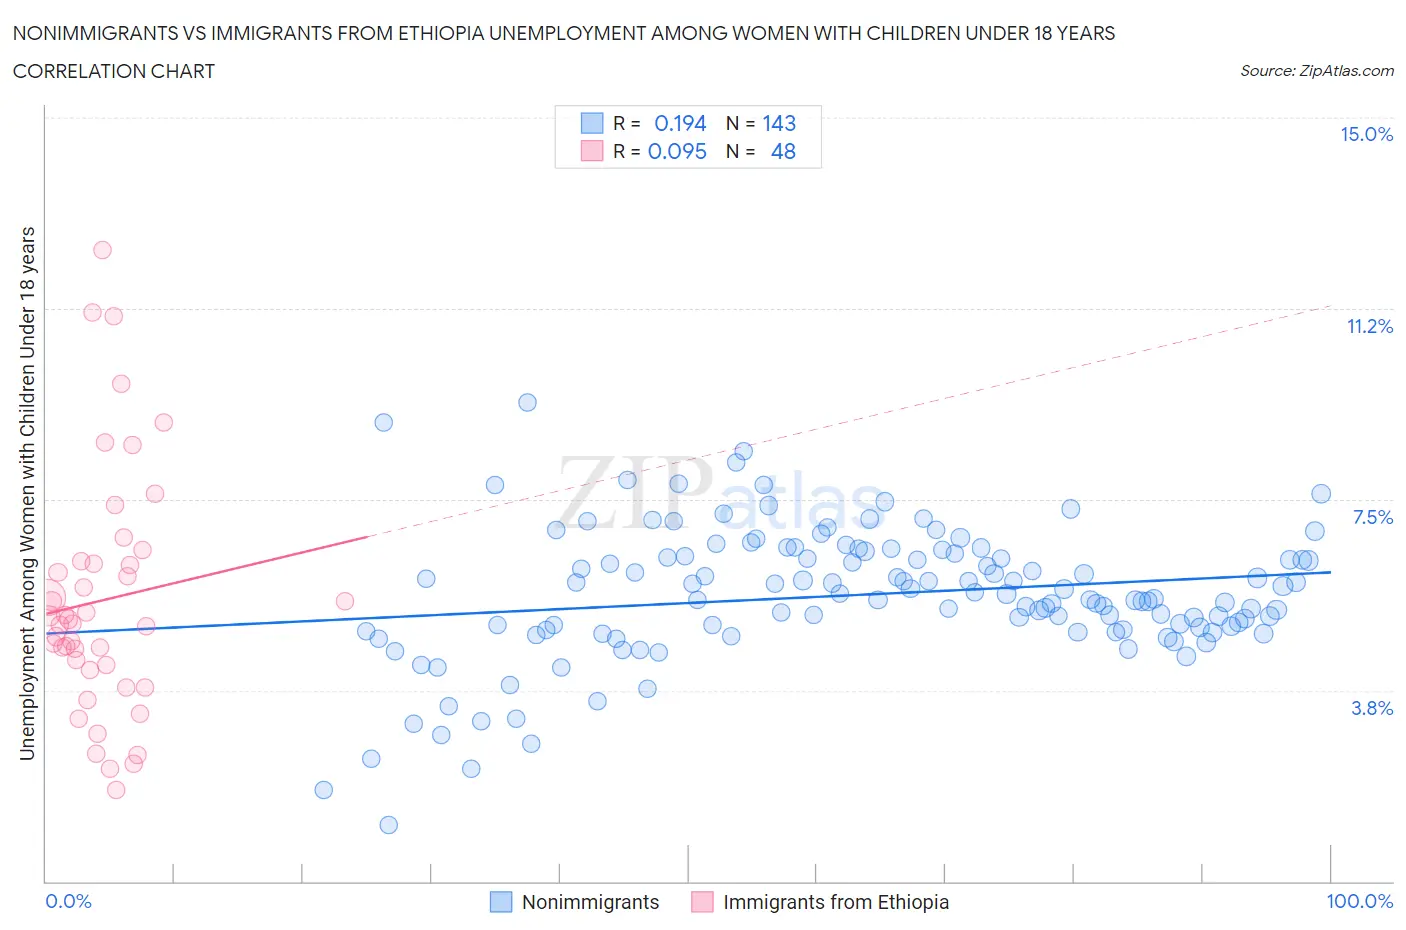
Nonimmigrants vs Immigrants from Ethiopia Unemployment Among Women with Children Under 18 years Correlation Chart

The statistical analysis conducted on geographies consisting of 514,953,140 people shows a poor positive correlation between the proportion of Nonimmigrants and unemployment rate among women with children under the age of 18 in the United States with a correlation coefficient (R) of 0.194 and weighted average of 5.7%. Similarly, the statistical analysis conducted on geographies consisting of 207,951,626 people shows a slight positive correlation between the proportion of Immigrants from Ethiopia and unemployment rate among women with children under the age of 18 in the United States with a correlation coefficient (R) of 0.095 and weighted average of 5.3%, a difference of 6.6%.
Nonimmigrants vs Immigrants from Ethiopia Unemployment Among Women with Children Under 18 years

Unemployment Among Women with Children Under 18 years Correlation Summary

MeasurementNonimmigrantsImmigrants from Ethiopia
Minimum1.1%1.8%
Maximum9.4%12.4%
Range8.3%10.6%
Mean5.6%5.5%
Median5.6%5.1%
Interquartile 25% (IQ1)4.9%4.2%
Interquartile 75% (IQ3)6.4%6.3%
Interquartile Range (IQR)1.5%2.1%
Standard Deviation (Sample)1.3%2.4%
Standard Deviation (Population)1.3%2.3%

Similar Demographics by Unemployment Among Women with Children Under 18 years

Demographics Similar to Nonimmigrants by Unemployment Among Women with Children Under 18 years

In terms of unemployment among women with children under 18 years, the demographic groups most similar to Nonimmigrants are Immigrants from Western Asia (5.6%, a difference of 0.11%), Panamanian (5.7%, a difference of 0.11%), South American (5.7%, a difference of 0.12%), Immigrants from Costa Rica (5.6%, a difference of 0.17%), and Peruvian (5.6%, a difference of 0.24%).
DemographicsRating | RankUnemployment Among Women with Children Under 18 years
Portuguese
15.9
/100
|
#203
Poor
5.6%
Israelis
15.6
/100
|
#204
Poor
5.6%
Tsimshian
15.2
/100
|
#205
Poor
5.6%
Nicaraguans
12.3
/100
|
#206
Poor
5.6%
Peruvians
12.1
/100
|
#207
Poor
5.6%
Immigrants | Costa Rica
11.6
/100
|
#208
Poor
5.6%
Immigrants | Western Asia
11.3
/100
|
#209
Poor
5.6%
Immigrants | Nonimmigrants
10.6
/100
|
#210
Poor
5.7%
Panamanians
10.1
/100
|
#211
Poor
5.7%
South Americans
10.0
/100
|
#212
Poor
5.7%
Americans
8.9
/100
|
#213
Tragic
5.7%
Japanese
8.7
/100
|
#214
Tragic
5.7%
Immigrants | Uganda
7.9
/100
|
#215
Tragic
5.7%
Immigrants | Peru
7.4
/100
|
#216
Tragic
5.7%
Immigrants | Brazil
7.1
/100
|
#217
Tragic
5.7%

Demographics Similar to Immigrants from Ethiopia by Unemployment Among Women with Children Under 18 years

In terms of unemployment among women with children under 18 years, the demographic groups most similar to Immigrants from Ethiopia are Immigrants from Israel (5.3%, a difference of 0.070%), Ethiopian (5.3%, a difference of 0.080%), Immigrants from Austria (5.3%, a difference of 0.090%), Slovak (5.3%, a difference of 0.11%), and Immigrants from Italy (5.3%, a difference of 0.12%).
DemographicsRating | RankUnemployment Among Women with Children Under 18 years
Immigrants | North Macedonia
83.2
/100
|
#125
Excellent
5.3%
Immigrants | Oceania
83.1
/100
|
#126
Excellent
5.3%
Whites/Caucasians
82.9
/100
|
#127
Excellent
5.3%
Immigrants | South Africa
82.8
/100
|
#128
Excellent
5.3%
Immigrants | Italy
82.3
/100
|
#129
Excellent
5.3%
Immigrants | Austria
82.1
/100
|
#130
Excellent
5.3%
Immigrants | Israel
81.9
/100
|
#131
Excellent
5.3%
Immigrants | Ethiopia
81.4
/100
|
#132
Excellent
5.3%
Ethiopians
80.7
/100
|
#133
Excellent
5.3%
Slovaks
80.5
/100
|
#134
Excellent
5.3%
New Zealanders
79.9
/100
|
#135
Good
5.3%
Immigrants | Jordan
79.5
/100
|
#136
Good
5.3%
Jordanians
78.8
/100
|
#137
Good
5.3%
Argentineans
78.8
/100
|
#138
Good
5.3%
Immigrants | Ukraine
78.5
/100
|
#139
Good
5.3%