Nepalese vs Yugoslavian Unemployment Among Seniors over 65 years

COMPARE

Nepalese
Race
Ancestry
AfghanAfricanAlaska NativeAlaskan AthabascanAlbanianAleutAlsatianAmericanApacheArabArapahoArgentineanArmenianAssyrian/Chaldean/SyriacAustralianAustrianBahamianBangladeshiBarbadianBasqueBelgianBelizeanBermudanBhutaneseBlackfeetBolivianBrazilianBritishBritish West IndianBulgarianBurmeseCajunCambodianCanadianCape VerdeanCarpatho RusynCelticCentral AmericanCentral American IndianCherokeeCheyenneChickasawChileanChineseChippewaChoctawColombianColvilleComancheCosta RicanCreeCreekCroatianCrowCubanCypriotCzechCzechoslovakianDanishDelawareDominicanDutchDutch West IndianEastern EuropeanEcuadorianEgyptianEnglishEstonianEthiopianEuropeanFijianFilipinoFinnishFrenchFrench American IndianFrench CanadianGermanGerman RussianGhanaianGreekGuamanian/ChamorroGuatemalanGuyaneseHaitianHmongHonduranHopiHoumaHungarianIcelanderIndian (Asian)IndonesianInupiatIranianIraqiIrishIroquoisIsraeliItalianJamaicanJapaneseJordanianKenyanKiowaKoreanLaotianLatvianLebaneseLiberianLithuanianLumbeeLuxembourgerMacedonianMalaysianMalteseMarshalleseMenomineeMexicanMexican American IndianMongolianMoroccanNative HawaiianNavajoNepaleseNew ZealanderNicaraguanNigerianNorthern EuropeanNorwegianOkinawanOsageOttawaPaiutePakistaniPalestinianPanamanianParaguayanPennsylvania GermanPeruvianPimaPolishPortuguesePotawatomiPuebloPuerto RicanPuget Sound SalishRomanianRussianSalvadoranSamoanScandinavianScotch-IrishScottishSeminoleSenegaleseSerbianShoshoneSierra LeoneanSiouxSlavicSlovakSloveneSomaliSouth AfricanSouth AmericanSouth American IndianSoviet UnionSpaniardSpanishSpanish AmericanSpanish American IndianSri LankanSubsaharan AfricanSudaneseSwedishSwissSyrianTaiwaneseThaiTlingit-HaidaTohono O'OdhamTonganTrinidadian and TobagonianTsimshianTurkishU.S. Virgin IslanderUgandanUkrainianUruguayanUteVenezuelanVietnameseWelshWest IndianYakamaYaquiYumanYup'ikZimbabwean
Immigration
NonimmigrantsImmigrantsAfghanistanAfricaAlbaniaArgentinaArmeniaAsiaAustraliaAustriaBahamasBangladeshBarbadosBelarusBelgiumBelizeBoliviaBosnia and HerzegovinaBrazilBulgariaBurma/MyanmarCabo VerdeCambodiaCameroonCanadaCaribbeanCentral AmericaChileChinaColombiaCongoCosta RicaCroatiaCubaCzechoslovakiaDenmarkDominicaDominican RepublicEastern AfricaEastern AsiaEastern EuropeEcuadorEgyptEl SalvadorEnglandEritreaEthiopiaEuropeFijiFranceGermanyGhanaGreeceGrenadaGuatemalaGuyanaHaitiHondurasHong KongHungaryIndiaIndonesiaIranIraqIrelandIsraelItalyJamaicaJapanJordanKazakhstanKenyaKoreaKuwaitLaosLatin AmericaLatviaLebanonLiberiaLithuaniaMalaysiaMexicoMicronesiaMiddle AfricaMoldovaMoroccoNepalNetherlandsNicaraguaNigeriaNorth AmericaNorth MacedoniaNorthern AfricaNorthern EuropeNorwayOceaniaPakistanPanamaPeruPhilippinesPolandPortugalRomaniaRussiaSaudi ArabiaScotlandSenegalSerbiaSierra LeoneSingaporeSomaliaSouth AfricaSouth AmericaSouth Central AsiaSouth Eastern AsiaSouthern EuropeSpainSri LankaSt. Vincent and the GrenadinesSudanSwedenSwitzerlandSyriaTaiwanThailandTrinidad and TobagoTurkeyUgandaUkraineUruguayUzbekistanVenezuelaVietnamWest IndiesWestern AfricaWestern AsiaWestern EuropeYemenZaireZimbabweAzores
Yugoslavian
Race
Ancestry
AfghanAfricanAlaska NativeAlaskan AthabascanAlbanianAleutAlsatianAmericanApacheArabArapahoArgentineanArmenianAssyrian/Chaldean/SyriacAustralianAustrianBahamianBangladeshiBarbadianBasqueBelgianBelizeanBermudanBhutaneseBlackfeetBolivianBrazilianBritishBritish West IndianBulgarianBurmeseCajunCambodianCanadianCape VerdeanCarpatho RusynCelticCentral AmericanCentral American IndianCherokeeCheyenneChickasawChileanChineseChippewaChoctawColombianColvilleComancheCosta RicanCreeCreekCroatianCrowCubanCypriotCzechCzechoslovakianDanishDelawareDominicanDutchDutch West IndianEastern EuropeanEcuadorianEgyptianEnglishEstonianEthiopianEuropeanFijianFilipinoFinnishFrenchFrench American IndianFrench CanadianGermanGerman RussianGhanaianGreekGuamanian/ChamorroGuatemalanGuyaneseHaitianHmongHonduranHopiHoumaHungarianIcelanderIndian (Asian)IndonesianInupiatIranianIraqiIrishIroquoisIsraeliItalianJamaicanJapaneseJordanianKenyanKiowaKoreanLaotianLatvianLebaneseLiberianLithuanianLumbeeLuxembourgerMacedonianMalaysianMalteseMarshalleseMenomineeMexicanMexican American IndianMongolianMoroccanNative HawaiianNavajoNew ZealanderNicaraguanNigerianNorthern EuropeanNorwegianOkinawanOsageOttawaPaiutePakistaniPalestinianPanamanianParaguayanPennsylvania GermanPeruvianPimaPolishPortuguesePotawatomiPuebloPuerto RicanPuget Sound SalishRomanianRussianSalvadoranSamoanScandinavianScotch-IrishScottishSeminoleSenegaleseSerbianShoshoneSierra LeoneanSiouxSlavicSlovakSloveneSomaliSouth AfricanSouth AmericanSouth American IndianSoviet UnionSpaniardSpanishSpanish AmericanSpanish American IndianSri LankanSubsaharan AfricanSudaneseSwedishSwissSyrianTaiwaneseThaiTlingit-HaidaTohono O'OdhamTonganTrinidadian and TobagonianTsimshianTurkishU.S. Virgin IslanderUgandanUkrainianUruguayanUteVenezuelanVietnameseWelshWest IndianYakamaYaquiYugoslavianYumanYup'ikZimbabwean
Immigration
NonimmigrantsImmigrantsAfghanistanAfricaAlbaniaArgentinaArmeniaAsiaAustraliaAustriaBahamasBangladeshBarbadosBelarusBelgiumBelizeBoliviaBosnia and HerzegovinaBrazilBulgariaBurma/MyanmarCabo VerdeCambodiaCameroonCanadaCaribbeanCentral AmericaChileChinaColombiaCongoCosta RicaCroatiaCubaCzechoslovakiaDenmarkDominicaDominican RepublicEastern AfricaEastern AsiaEastern EuropeEcuadorEgyptEl SalvadorEnglandEritreaEthiopiaEuropeFijiFranceGermanyGhanaGreeceGrenadaGuatemalaGuyanaHaitiHondurasHong KongHungaryIndiaIndonesiaIranIraqIrelandIsraelItalyJamaicaJapanJordanKazakhstanKenyaKoreaKuwaitLaosLatin AmericaLatviaLebanonLiberiaLithuaniaMalaysiaMexicoMicronesiaMiddle AfricaMoldovaMoroccoNepalNetherlandsNicaraguaNigeriaNorth AmericaNorth MacedoniaNorthern AfricaNorthern EuropeNorwayOceaniaPakistanPanamaPeruPhilippinesPolandPortugalRomaniaRussiaSaudi ArabiaScotlandSenegalSerbiaSierra LeoneSingaporeSomaliaSouth AfricaSouth AmericaSouth Central AsiaSouth Eastern AsiaSouthern EuropeSpainSri LankaSt. Vincent and the GrenadinesSudanSwedenSwitzerlandSyriaTaiwanThailandTrinidad and TobagoTurkeyUgandaUkraineUruguayUzbekistanVenezuelaVietnamWest IndiesWestern AfricaWestern AsiaWestern EuropeYemenZaireZimbabweAzores
Unemployment Among Seniors over 65 years
Income
Poverty
Unemployment
Labor Participation
Family Structure
Vehicle Availability
Education Level
Disability

Unemployment Among Seniors over 65 years Comparison

Nepalese

Yugoslavians

Good
Exceptional
5.1%
UNEMPLOYMENT AMONG SENIORS OVER 65 YEARS
64.5/ 100
METRIC RATING
164th/ 347
METRIC RANK
5.0%
UNEMPLOYMENT AMONG SENIORS OVER 65 YEARS
95.4/ 100
METRIC RATING
101st/ 347
METRIC RANK

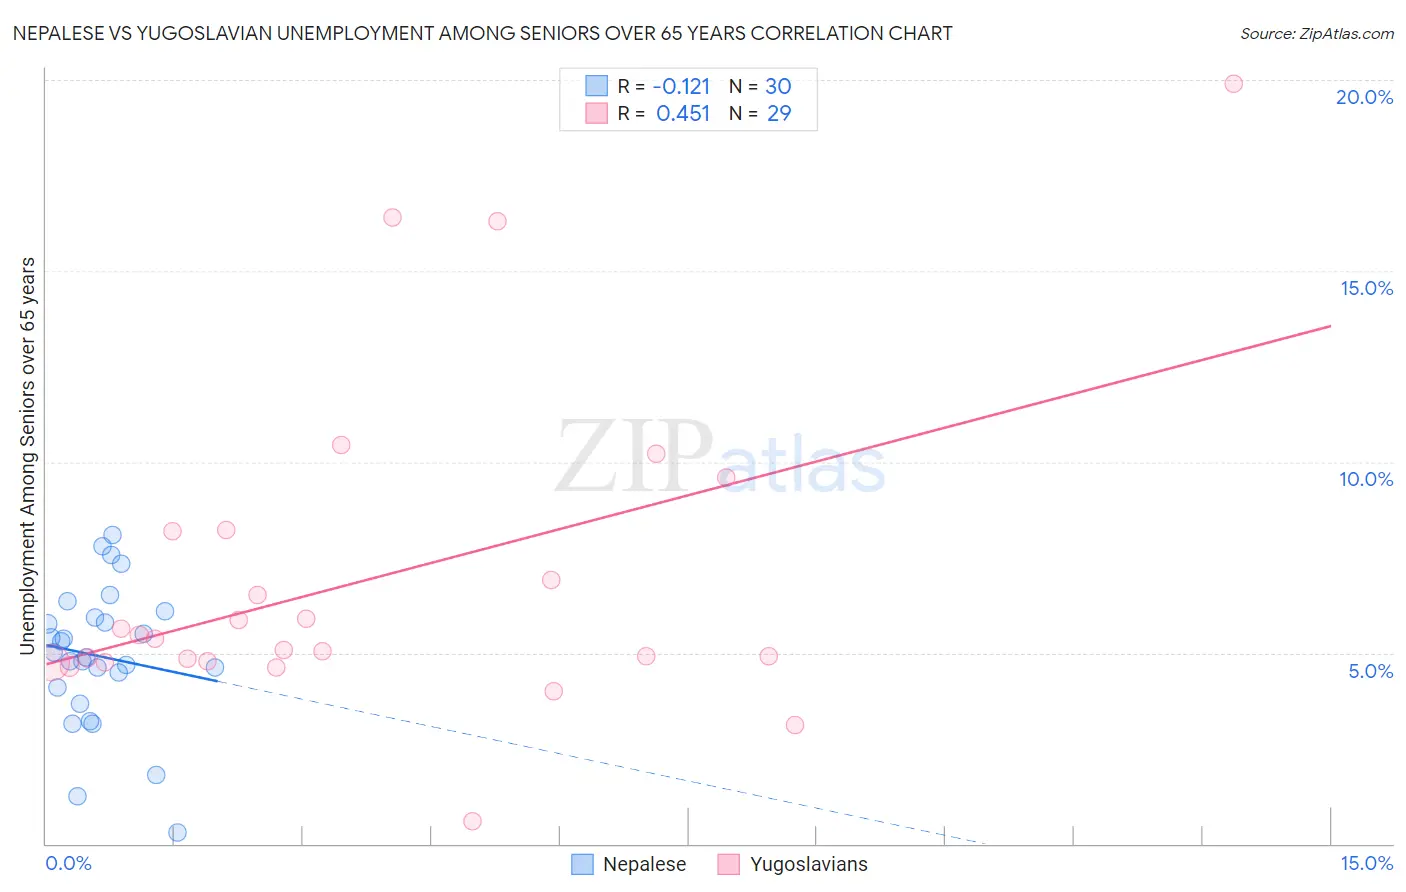
Nepalese vs Yugoslavian Unemployment Among Seniors over 65 years Correlation Chart

The statistical analysis conducted on geographies consisting of 24,020,943 people shows a poor negative correlation between the proportion of Nepalese and unemployment rate amomg seniors over the age of 65 in the United States with a correlation coefficient (R) of -0.121 and weighted average of 5.1%. Similarly, the statistical analysis conducted on geographies consisting of 263,100,385 people shows a moderate positive correlation between the proportion of Yugoslavians and unemployment rate amomg seniors over the age of 65 in the United States with a correlation coefficient (R) of 0.451 and weighted average of 5.0%, a difference of 2.0%.
Nepalese vs Yugoslavian Unemployment Among Seniors over 65 years

Unemployment Among Seniors over 65 years Correlation Summary

MeasurementNepaleseYugoslavian
Minimum0.30%0.60%
Maximum8.1%19.9%
Range7.8%19.3%
Mean4.9%7.0%
Median4.9%5.4%
Interquartile 25% (IQ1)4.1%4.8%
Interquartile 75% (IQ3)5.9%8.2%
Interquartile Range (IQR)1.8%3.4%
Standard Deviation (Sample)1.8%4.2%
Standard Deviation (Population)1.8%4.1%

Similar Demographics by Unemployment Among Seniors over 65 years

Demographics Similar to Nepalese by Unemployment Among Seniors over 65 years

In terms of unemployment among seniors over 65 years, the demographic groups most similar to Nepalese are Potawatomi (5.1%, a difference of 0.0%), Immigrants from Ukraine (5.1%, a difference of 0.010%), Immigrants from Laos (5.1%, a difference of 0.020%), Immigrants from South Eastern Asia (5.1%, a difference of 0.040%), and Immigrants from Bosnia and Herzegovina (5.1%, a difference of 0.060%).
DemographicsRating | RankUnemployment Among Seniors over 65 years
Immigrants | Northern Europe
69.8
/100
|
#157
Good
5.1%
Immigrants | Belarus
69.0
/100
|
#158
Good
5.1%
Immigrants | France
68.6
/100
|
#159
Good
5.1%
French
68.1
/100
|
#160
Good
5.1%
Immigrants | Bosnia and Herzegovina
66.1
/100
|
#161
Good
5.1%
Immigrants | South Eastern Asia
65.6
/100
|
#162
Good
5.1%
Potawatomi
64.5
/100
|
#163
Good
5.1%
Nepalese
64.5
/100
|
#164
Good
5.1%
Immigrants | Ukraine
64.2
/100
|
#165
Good
5.1%
Immigrants | Laos
63.8
/100
|
#166
Good
5.1%
Immigrants | Western Europe
60.4
/100
|
#167
Good
5.1%
Mongolians
59.8
/100
|
#168
Average
5.1%
Lithuanians
58.2
/100
|
#169
Average
5.1%
Immigrants | Eastern Asia
54.9
/100
|
#170
Average
5.1%
Immigrants | Nonimmigrants
54.1
/100
|
#171
Average
5.1%

Demographics Similar to Yugoslavians by Unemployment Among Seniors over 65 years

In terms of unemployment among seniors over 65 years, the demographic groups most similar to Yugoslavians are Immigrants from Thailand (5.0%, a difference of 0.010%), Romanian (5.0%, a difference of 0.020%), Immigrants from Lithuania (5.0%, a difference of 0.060%), Immigrants from Scotland (5.0%, a difference of 0.080%), and Okinawan (5.0%, a difference of 0.13%).
DemographicsRating | RankUnemployment Among Seniors over 65 years
Burmese
96.8
/100
|
#94
Exceptional
5.0%
Assyrians/Chaldeans/Syriacs
96.8
/100
|
#95
Exceptional
5.0%
Immigrants | Singapore
96.8
/100
|
#96
Exceptional
5.0%
Immigrants | Oceania
96.8
/100
|
#97
Exceptional
5.0%
Czechoslovakians
96.7
/100
|
#98
Exceptional
5.0%
South Africans
96.5
/100
|
#99
Exceptional
5.0%
Romanians
95.5
/100
|
#100
Exceptional
5.0%
Yugoslavians
95.4
/100
|
#101
Exceptional
5.0%
Immigrants | Thailand
95.4
/100
|
#102
Exceptional
5.0%
Immigrants | Lithuania
95.1
/100
|
#103
Exceptional
5.0%
Immigrants | Scotland
95.0
/100
|
#104
Exceptional
5.0%
Okinawans
94.7
/100
|
#105
Exceptional
5.0%
Immigrants | Turkey
94.3
/100
|
#106
Exceptional
5.0%
Immigrants | Germany
93.2
/100
|
#107
Exceptional
5.0%
Immigrants | Vietnam
92.9
/100
|
#108
Exceptional
5.0%