Nepalese vs Taiwanese Unemployment Among Ages 20 to 24 years
COMPARE
Nepalese
Taiwanese
Unemployment Among Ages 20 to 24 years
Unemployment Among Ages 20 to 24 years Comparison
Nepalese
Taiwanese
10.6%
UNEMPLOYMENT AMONG AGES 20 TO 24 YEARS
5.1/ 100
METRIC RATING
224th/ 347
METRIC RANK
9.4%
UNEMPLOYMENT AMONG AGES 20 TO 24 YEARS
100.0/ 100
METRIC RATING
24th/ 347
METRIC RANK
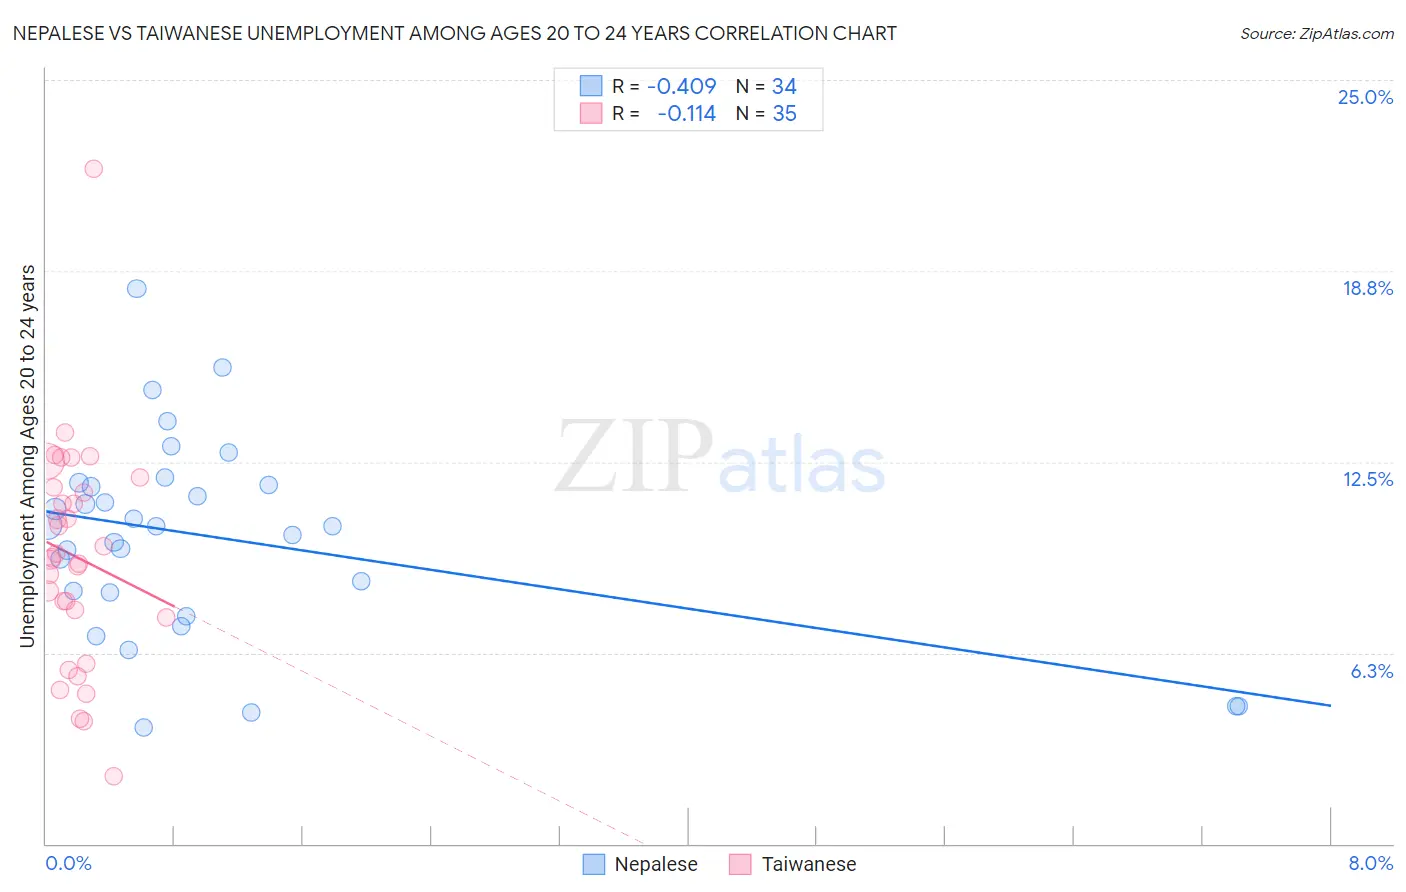
Nepalese vs Taiwanese Unemployment Among Ages 20 to 24 years Correlation Chart
The statistical analysis conducted on geographies consisting of 24,479,281 people shows a moderate negative correlation between the proportion of Nepalese and unemployment rate among population between the ages 20 and 24 in the United States with a correlation coefficient (R) of -0.409 and weighted average of 10.6%. Similarly, the statistical analysis conducted on geographies consisting of 31,679,068 people shows a poor negative correlation between the proportion of Taiwanese and unemployment rate among population between the ages 20 and 24 in the United States with a correlation coefficient (R) of -0.114 and weighted average of 9.4%, a difference of 12.1%.
Unemployment Among Ages 20 to 24 years Correlation Summary
| Measurement | Nepalese | Taiwanese |
| Minimum | 3.8% | 2.2% |
| Maximum | 18.2% | 22.1% |
| Range | 14.4% | 19.9% |
| Mean | 10.0% | 9.4% |
| Median | 10.4% | 9.4% |
| Interquartile 25% (IQ1) | 8.2% | 7.4% |
| Interquartile 75% (IQ3) | 11.7% | 11.7% |
| Interquartile Range (IQR) | 3.5% | 4.3% |
| Standard Deviation (Sample) | 3.3% | 3.7% |
| Standard Deviation (Population) | 3.2% | 3.6% |
Similar Demographics by Unemployment Among Ages 20 to 24 years
Demographics Similar to Nepalese by Unemployment Among Ages 20 to 24 years
In terms of unemployment among ages 20 to 24 years, the demographic groups most similar to Nepalese are Immigrants from South America (10.6%, a difference of 0.010%), Immigrants from Costa Rica (10.6%, a difference of 0.040%), Palestinian (10.6%, a difference of 0.040%), Arab (10.6%, a difference of 0.090%), and Mexican American Indian (10.6%, a difference of 0.11%).
| Demographics | Rating | Rank | Unemployment Among Ages 20 to 24 years |
| Cherokee | 9.3 /100 | #217 | Tragic 10.5% |
| Immigrants | Nonimmigrants | 8.8 /100 | #218 | Tragic 10.5% |
| Immigrants | Southern Europe | 8.0 /100 | #219 | Tragic 10.5% |
| Eastern Europeans | 6.9 /100 | #220 | Tragic 10.6% |
| Central Americans | 6.8 /100 | #221 | Tragic 10.6% |
| Immigrants | Poland | 6.4 /100 | #222 | Tragic 10.6% |
| Arabs | 5.6 /100 | #223 | Tragic 10.6% |
| Nepalese | 5.1 /100 | #224 | Tragic 10.6% |
| Immigrants | South America | 5.1 /100 | #225 | Tragic 10.6% |
| Immigrants | Costa Rica | 4.9 /100 | #226 | Tragic 10.6% |
| Palestinians | 4.9 /100 | #227 | Tragic 10.6% |
| Mexican American Indians | 4.6 /100 | #228 | Tragic 10.6% |
| Americans | 4.4 /100 | #229 | Tragic 10.6% |
| French American Indians | 4.1 /100 | #230 | Tragic 10.6% |
| Native Hawaiians | 3.9 /100 | #231 | Tragic 10.6% |
Demographics Similar to Taiwanese by Unemployment Among Ages 20 to 24 years
In terms of unemployment among ages 20 to 24 years, the demographic groups most similar to Taiwanese are Immigrants from Eritrea (9.5%, a difference of 0.25%), Swedish (9.5%, a difference of 0.25%), Tongan (9.4%, a difference of 0.31%), Immigrants from Nepal (9.4%, a difference of 0.31%), and Immigrants from Bosnia and Herzegovina (9.4%, a difference of 0.58%).
| Demographics | Rating | Rank | Unemployment Among Ages 20 to 24 years |
| Czechs | 100.0 /100 | #17 | Exceptional 9.3% |
| Chinese | 100.0 /100 | #18 | Exceptional 9.4% |
| Hmong | 100.0 /100 | #19 | Exceptional 9.4% |
| Osage | 100.0 /100 | #20 | Exceptional 9.4% |
| Immigrants | Bosnia and Herzegovina | 100.0 /100 | #21 | Exceptional 9.4% |
| Tongans | 100.0 /100 | #22 | Exceptional 9.4% |
| Immigrants | Nepal | 100.0 /100 | #23 | Exceptional 9.4% |
| Taiwanese | 100.0 /100 | #24 | Exceptional 9.4% |
| Immigrants | Eritrea | 100.0 /100 | #25 | Exceptional 9.5% |
| Swedes | 100.0 /100 | #26 | Exceptional 9.5% |
| Immigrants | Zimbabwe | 100.0 /100 | #27 | Exceptional 9.5% |
| Immigrants | Afghanistan | 100.0 /100 | #28 | Exceptional 9.5% |
| Immigrants | North Macedonia | 100.0 /100 | #29 | Exceptional 9.5% |
| Scandinavians | 100.0 /100 | #30 | Exceptional 9.5% |
| Immigrants | Eastern Africa | 100.0 /100 | #31 | Exceptional 9.5% |