Nepalese vs Iraqi Unemployment Among Ages 16 to 19 years
COMPARE
Nepalese
Iraqi
Unemployment Among Ages 16 to 19 years
Unemployment Among Ages 16 to 19 years Comparison
Nepalese
Iraqis
18.2%
UNEMPLOYMENT AMONG AGES 16 TO 19 YEARS
4.2/ 100
METRIC RATING
231st/ 347
METRIC RANK
16.4%
UNEMPLOYMENT AMONG AGES 16 TO 19 YEARS
99.7/ 100
METRIC RATING
49th/ 347
METRIC RANK
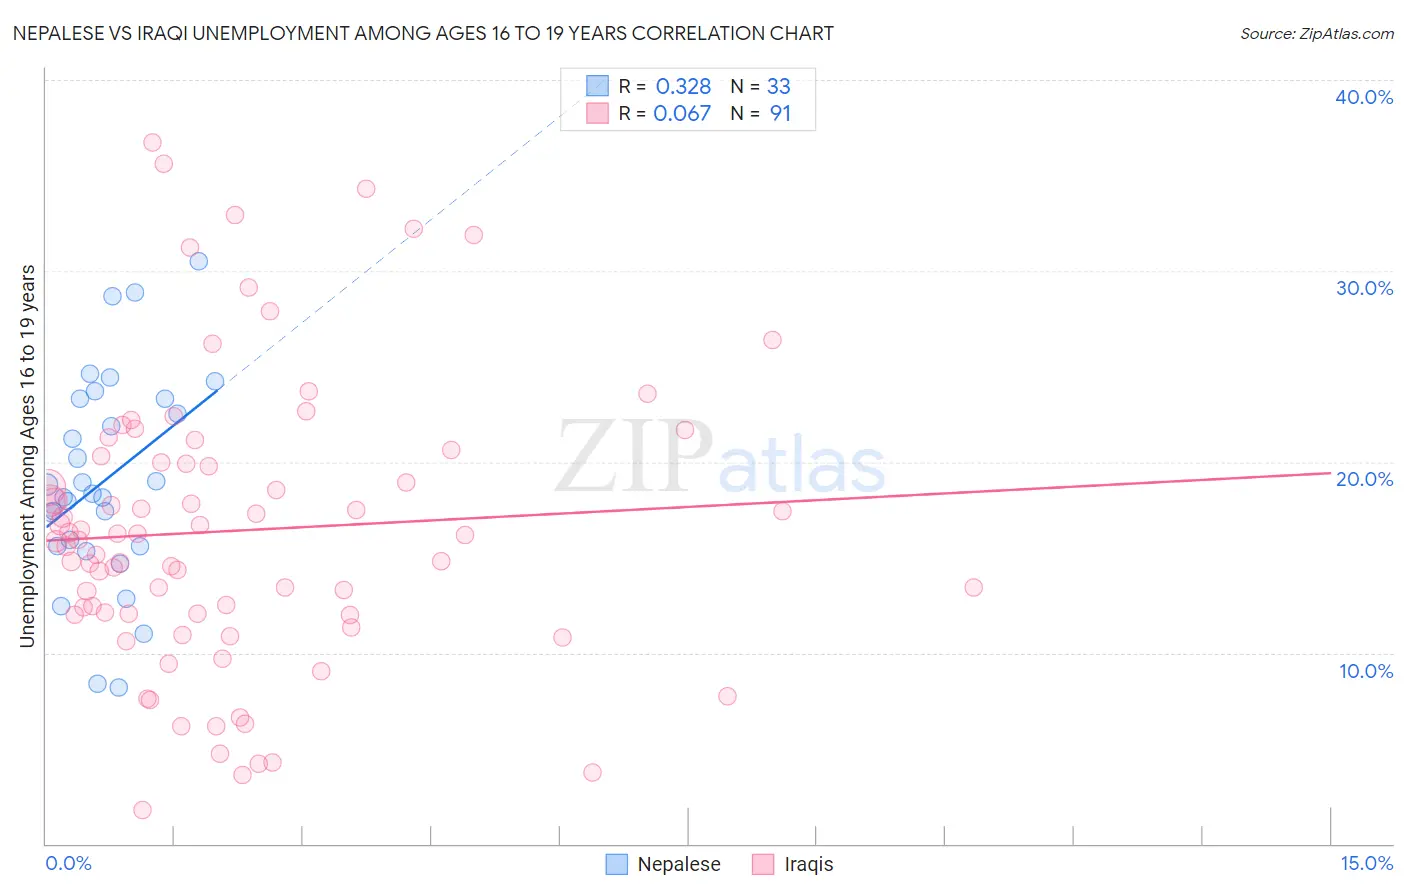
Nepalese vs Iraqi Unemployment Among Ages 16 to 19 years Correlation Chart
The statistical analysis conducted on geographies consisting of 24,305,512 people shows a mild positive correlation between the proportion of Nepalese and unemployment rate among population between the ages 16 and 19 in the United States with a correlation coefficient (R) of 0.328 and weighted average of 18.2%. Similarly, the statistical analysis conducted on geographies consisting of 166,767,371 people shows a slight positive correlation between the proportion of Iraqis and unemployment rate among population between the ages 16 and 19 in the United States with a correlation coefficient (R) of 0.067 and weighted average of 16.4%, a difference of 11.2%.
Unemployment Among Ages 16 to 19 years Correlation Summary
| Measurement | Nepalese | Iraqi |
| Minimum | 8.2% | 1.8% |
| Maximum | 30.5% | 36.7% |
| Range | 22.3% | 34.9% |
| Mean | 19.1% | 16.4% |
| Median | 18.3% | 15.9% |
| Interquartile 25% (IQ1) | 15.6% | 12.0% |
| Interquartile 75% (IQ3) | 23.3% | 20.3% |
| Interquartile Range (IQR) | 7.7% | 8.3% |
| Standard Deviation (Sample) | 5.4% | 7.6% |
| Standard Deviation (Population) | 5.4% | 7.5% |
Similar Demographics by Unemployment Among Ages 16 to 19 years
Demographics Similar to Nepalese by Unemployment Among Ages 16 to 19 years
In terms of unemployment among ages 16 to 19 years, the demographic groups most similar to Nepalese are Immigrants from Russia (18.2%, a difference of 0.050%), Seminole (18.2%, a difference of 0.050%), Spanish American (18.2%, a difference of 0.14%), Colombian (18.3%, a difference of 0.16%), and Albanian (18.2%, a difference of 0.39%).
| Demographics | Rating | Rank | Unemployment Among Ages 16 to 19 years |
| Immigrants | Serbia | 8.3 /100 | #224 | Tragic 18.1% |
| Immigrants | Chile | 7.5 /100 | #225 | Tragic 18.1% |
| Immigrants | Belgium | 7.3 /100 | #226 | Tragic 18.1% |
| Immigrants | Liberia | 7.1 /100 | #227 | Tragic 18.1% |
| Immigrants | Greece | 7.1 /100 | #228 | Tragic 18.1% |
| Albanians | 5.8 /100 | #229 | Tragic 18.2% |
| Spanish Americans | 4.7 /100 | #230 | Tragic 18.2% |
| Nepalese | 4.2 /100 | #231 | Tragic 18.2% |
| Immigrants | Russia | 4.0 /100 | #232 | Tragic 18.2% |
| Seminole | 4.0 /100 | #233 | Tragic 18.2% |
| Colombians | 3.7 /100 | #234 | Tragic 18.3% |
| French American Indians | 2.9 /100 | #235 | Tragic 18.3% |
| Immigrants | Colombia | 2.7 /100 | #236 | Tragic 18.3% |
| Immigrants | Immigrants | 2.7 /100 | #237 | Tragic 18.3% |
| South Americans | 2.6 /100 | #238 | Tragic 18.3% |
Demographics Similar to Iraqis by Unemployment Among Ages 16 to 19 years
In terms of unemployment among ages 16 to 19 years, the demographic groups most similar to Iraqis are Maltese (16.4%, a difference of 0.070%), Immigrants from Vietnam (16.4%, a difference of 0.12%), Bhutanese (16.4%, a difference of 0.14%), Immigrants from North Macedonia (16.4%, a difference of 0.19%), and Polish (16.4%, a difference of 0.21%).
| Demographics | Rating | Rank | Unemployment Among Ages 16 to 19 years |
| Fijians | 99.8 /100 | #42 | Exceptional 16.3% |
| Immigrants | Lebanon | 99.8 /100 | #43 | Exceptional 16.3% |
| Immigrants | Zimbabwe | 99.7 /100 | #44 | Exceptional 16.3% |
| Poles | 99.7 /100 | #45 | Exceptional 16.4% |
| Immigrants | North Macedonia | 99.7 /100 | #46 | Exceptional 16.4% |
| Immigrants | Vietnam | 99.7 /100 | #47 | Exceptional 16.4% |
| Maltese | 99.7 /100 | #48 | Exceptional 16.4% |
| Iraqis | 99.7 /100 | #49 | Exceptional 16.4% |
| Bhutanese | 99.6 /100 | #50 | Exceptional 16.4% |
| Lebanese | 99.6 /100 | #51 | Exceptional 16.4% |
| Welsh | 99.6 /100 | #52 | Exceptional 16.4% |
| Slovenes | 99.6 /100 | #53 | Exceptional 16.4% |
| British | 99.5 /100 | #54 | Exceptional 16.5% |
| Czechoslovakians | 99.5 /100 | #55 | Exceptional 16.5% |
| Sri Lankans | 99.5 /100 | #56 | Exceptional 16.5% |