Navajo vs Immigrants from Uruguay Unemployment Among Ages 25 to 29 years
COMPARE
Navajo
Immigrants from Uruguay
Unemployment Among Ages 25 to 29 years
Unemployment Among Ages 25 to 29 years Comparison
Navajo
Immigrants from Uruguay
12.2%
UNEMPLOYMENT AMONG AGES 25 TO 29 YEARS
0.0/ 100
METRIC RATING
342nd/ 347
METRIC RANK
6.5%
UNEMPLOYMENT AMONG AGES 25 TO 29 YEARS
85.7/ 100
METRIC RATING
117th/ 347
METRIC RANK
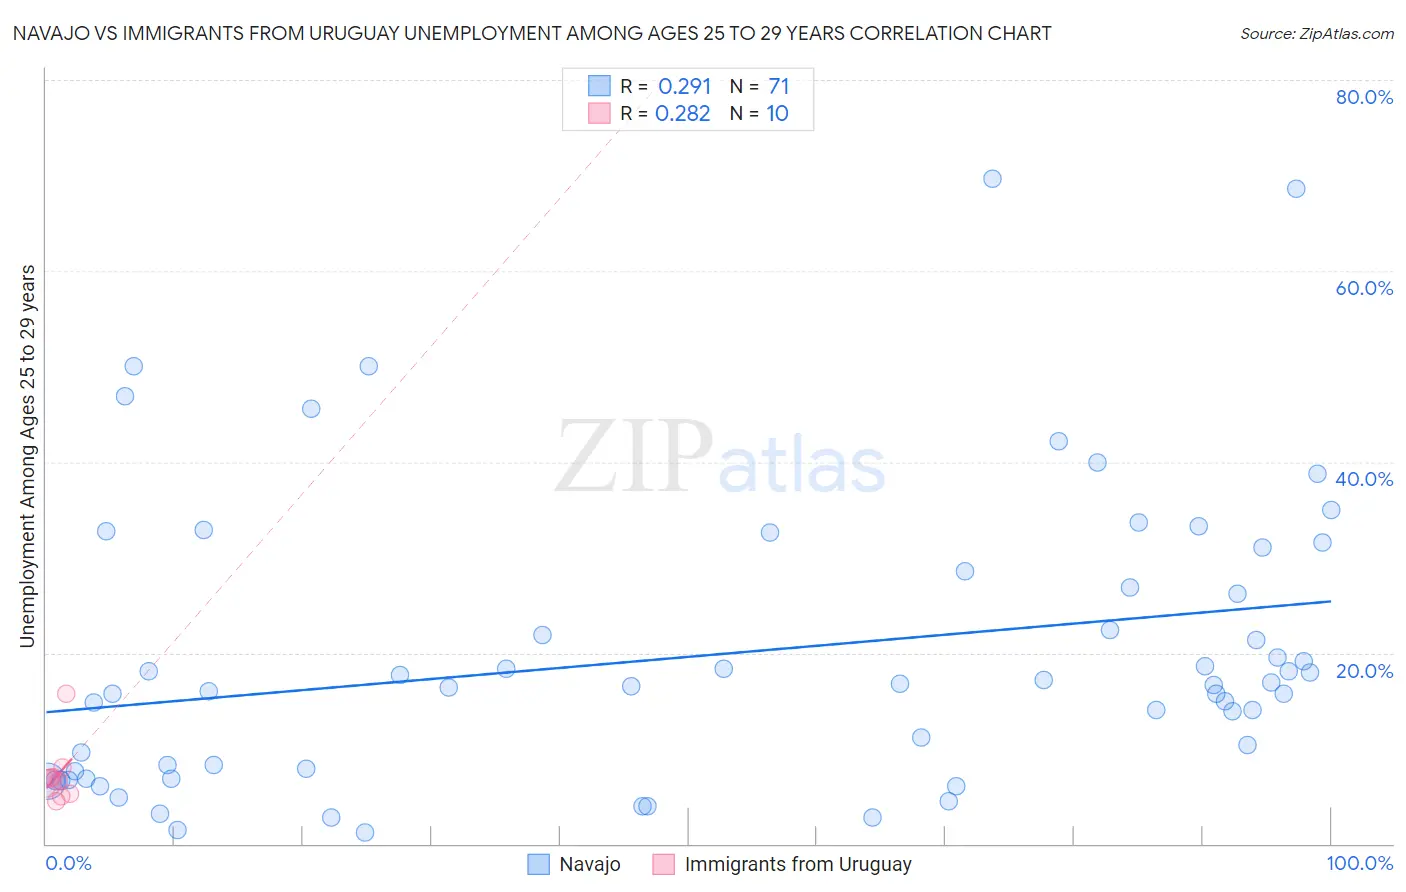
Navajo vs Immigrants from Uruguay Unemployment Among Ages 25 to 29 years Correlation Chart
The statistical analysis conducted on geographies consisting of 218,089,207 people shows a weak positive correlation between the proportion of Navajo and unemployment rate among population between the ages 25 and 29 in the United States with a correlation coefficient (R) of 0.291 and weighted average of 12.2%. Similarly, the statistical analysis conducted on geographies consisting of 130,747,334 people shows a weak positive correlation between the proportion of Immigrants from Uruguay and unemployment rate among population between the ages 25 and 29 in the United States with a correlation coefficient (R) of 0.282 and weighted average of 6.5%, a difference of 88.3%.
Unemployment Among Ages 25 to 29 years Correlation Summary
| Measurement | Navajo | Immigrants from Uruguay |
| Minimum | 1.2% | 4.4% |
| Maximum | 69.6% | 15.7% |
| Range | 68.4% | 11.3% |
| Mean | 19.8% | 7.2% |
| Median | 16.6% | 6.7% |
| Interquartile 25% (IQ1) | 7.6% | 5.3% |
| Interquartile 75% (IQ3) | 28.6% | 7.0% |
| Interquartile Range (IQR) | 21.0% | 1.7% |
| Standard Deviation (Sample) | 15.1% | 3.2% |
| Standard Deviation (Population) | 15.0% | 3.0% |
Similar Demographics by Unemployment Among Ages 25 to 29 years
Demographics Similar to Navajo by Unemployment Among Ages 25 to 29 years
In terms of unemployment among ages 25 to 29 years, the demographic groups most similar to Navajo are Tohono O'odham (12.1%, a difference of 0.80%), Cheyenne (11.8%, a difference of 2.9%), Pima (11.8%, a difference of 3.4%), Sioux (11.7%, a difference of 4.3%), and Menominee (11.3%, a difference of 8.0%).
| Demographics | Rating | Rank | Unemployment Among Ages 25 to 29 years |
| Alaskan Athabascans | 0.0 /100 | #333 | Tragic 10.8% |
| Yuman | 0.0 /100 | #334 | Tragic 11.0% |
| Puerto Ricans | 0.0 /100 | #335 | Tragic 11.1% |
| Lumbee | 0.0 /100 | #336 | Tragic 11.2% |
| Menominee | 0.0 /100 | #337 | Tragic 11.3% |
| Sioux | 0.0 /100 | #338 | Tragic 11.7% |
| Pima | 0.0 /100 | #339 | Tragic 11.8% |
| Cheyenne | 0.0 /100 | #340 | Tragic 11.8% |
| Tohono O'odham | 0.0 /100 | #341 | Tragic 12.1% |
| Navajo | 0.0 /100 | #342 | Tragic 12.2% |
| Inupiat | 0.0 /100 | #343 | Tragic 13.4% |
| Hopi | 0.0 /100 | #344 | Tragic 13.5% |
| Arapaho | 0.0 /100 | #345 | Tragic 15.4% |
| Crow | 0.0 /100 | #346 | Tragic 15.4% |
| Yup'ik | 0.0 /100 | #347 | Tragic 17.9% |
Demographics Similar to Immigrants from Uruguay by Unemployment Among Ages 25 to 29 years
In terms of unemployment among ages 25 to 29 years, the demographic groups most similar to Immigrants from Uruguay are Pakistani (6.5%, a difference of 0.020%), Macedonian (6.5%, a difference of 0.050%), Chilean (6.5%, a difference of 0.050%), German (6.5%, a difference of 0.080%), and Immigrants from South Africa (6.5%, a difference of 0.10%).
| Demographics | Rating | Rank | Unemployment Among Ages 25 to 29 years |
| Europeans | 87.8 /100 | #110 | Excellent 6.4% |
| Immigrants | Colombia | 87.6 /100 | #111 | Excellent 6.4% |
| Immigrants | Nicaragua | 87.5 /100 | #112 | Excellent 6.4% |
| Immigrants | Egypt | 87.1 /100 | #113 | Excellent 6.5% |
| Germans | 86.3 /100 | #114 | Excellent 6.5% |
| Macedonians | 86.1 /100 | #115 | Excellent 6.5% |
| Pakistanis | 85.9 /100 | #116 | Excellent 6.5% |
| Immigrants | Uruguay | 85.7 /100 | #117 | Excellent 6.5% |
| Chileans | 85.3 /100 | #118 | Excellent 6.5% |
| Immigrants | South Africa | 84.9 /100 | #119 | Excellent 6.5% |
| Immigrants | Moldova | 84.5 /100 | #120 | Excellent 6.5% |
| Immigrants | Uganda | 84.5 /100 | #121 | Excellent 6.5% |
| Immigrants | Belarus | 83.7 /100 | #122 | Excellent 6.5% |
| Laotians | 83.6 /100 | #123 | Excellent 6.5% |
| Arabs | 82.5 /100 | #124 | Excellent 6.5% |