Native/Alaskan vs Immigrants from Peru Unemployment Among Ages 45 to 54 years
COMPARE
Native/Alaskan
Immigrants from Peru
Unemployment Among Ages 45 to 54 years
Unemployment Among Ages 45 to 54 years Comparison
Natives/Alaskans
Immigrants from Peru
6.1%
UNEMPLOYMENT AMONG AGES 45 TO 54 YEARS
0.0/ 100
METRIC RATING
324th/ 347
METRIC RANK
4.6%
UNEMPLOYMENT AMONG AGES 45 TO 54 YEARS
19.1/ 100
METRIC RATING
202nd/ 347
METRIC RANK
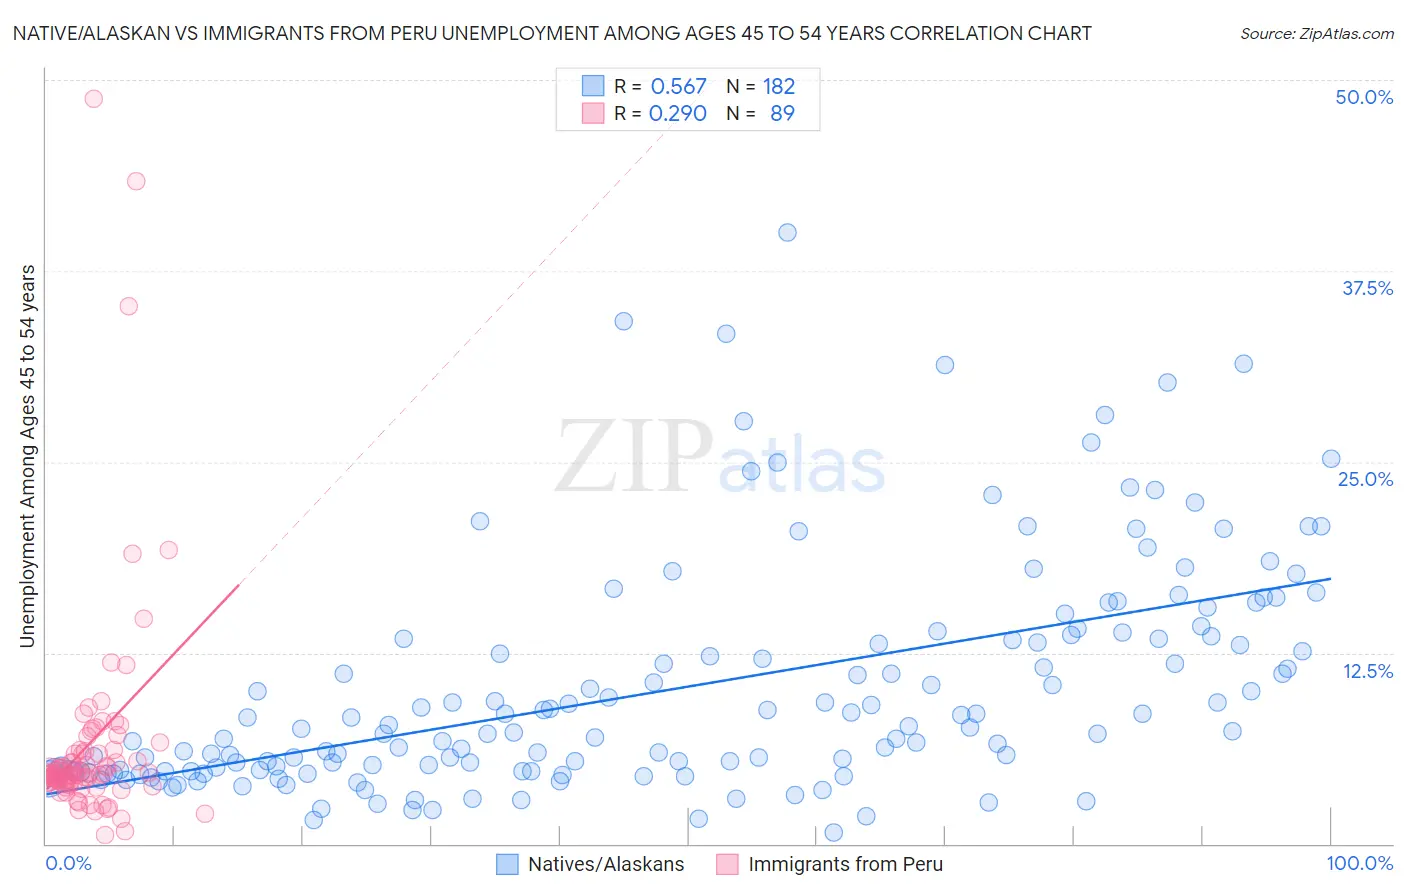
Native/Alaskan vs Immigrants from Peru Unemployment Among Ages 45 to 54 years Correlation Chart
The statistical analysis conducted on geographies consisting of 487,520,360 people shows a substantial positive correlation between the proportion of Natives/Alaskans and unemployment rate among population between the ages 45 and 54 in the United States with a correlation coefficient (R) of 0.567 and weighted average of 6.1%. Similarly, the statistical analysis conducted on geographies consisting of 323,495,452 people shows a weak positive correlation between the proportion of Immigrants from Peru and unemployment rate among population between the ages 45 and 54 in the United States with a correlation coefficient (R) of 0.290 and weighted average of 4.6%, a difference of 31.7%.
Unemployment Among Ages 45 to 54 years Correlation Summary
| Measurement | Native/Alaskan | Immigrants from Peru |
| Minimum | 0.71% | 0.60% |
| Maximum | 40.0% | 48.8% |
| Range | 39.3% | 48.2% |
| Mean | 10.2% | 6.6% |
| Median | 7.4% | 4.6% |
| Interquartile 25% (IQ1) | 4.8% | 4.0% |
| Interquartile 75% (IQ3) | 13.4% | 6.1% |
| Interquartile Range (IQR) | 8.7% | 2.1% |
| Standard Deviation (Sample) | 7.5% | 7.5% |
| Standard Deviation (Population) | 7.4% | 7.4% |
Similar Demographics by Unemployment Among Ages 45 to 54 years
Demographics Similar to Natives/Alaskans by Unemployment Among Ages 45 to 54 years
In terms of unemployment among ages 45 to 54 years, the demographic groups most similar to Natives/Alaskans are Immigrants from Armenia (6.1%, a difference of 1.3%), Ute (6.2%, a difference of 2.2%), Immigrants from Cabo Verde (5.9%, a difference of 2.3%), Dominican (6.2%, a difference of 2.4%), and Pueblo (6.2%, a difference of 2.6%).
| Demographics | Rating | Rank | Unemployment Among Ages 45 to 54 years |
| Houma | 0.0 /100 | #317 | Tragic 5.6% |
| British West Indians | 0.0 /100 | #318 | Tragic 5.7% |
| Cape Verdeans | 0.0 /100 | #319 | Tragic 5.7% |
| Immigrants | St. Vincent and the Grenadines | 0.0 /100 | #320 | Tragic 5.7% |
| Yakama | 0.0 /100 | #321 | Tragic 5.7% |
| Immigrants | Azores | 0.0 /100 | #322 | Tragic 5.7% |
| Immigrants | Cabo Verde | 0.0 /100 | #323 | Tragic 5.9% |
| Natives/Alaskans | 0.0 /100 | #324 | Tragic 6.1% |
| Immigrants | Armenia | 0.0 /100 | #325 | Tragic 6.1% |
| Ute | 0.0 /100 | #326 | Tragic 6.2% |
| Dominicans | 0.0 /100 | #327 | Tragic 6.2% |
| Pueblo | 0.0 /100 | #328 | Tragic 6.2% |
| Alaska Natives | 0.0 /100 | #329 | Tragic 6.3% |
| Immigrants | Dominican Republic | 0.0 /100 | #330 | Tragic 6.3% |
| Tohono O'odham | 0.0 /100 | #331 | Tragic 6.3% |
Demographics Similar to Immigrants from Peru by Unemployment Among Ages 45 to 54 years
In terms of unemployment among ages 45 to 54 years, the demographic groups most similar to Immigrants from Peru are Liberian (4.6%, a difference of 0.030%), Immigrants from Costa Rica (4.6%, a difference of 0.040%), Immigrants from Denmark (4.6%, a difference of 0.060%), Brazilian (4.6%, a difference of 0.070%), and Immigrants from Morocco (4.6%, a difference of 0.18%).
| Demographics | Rating | Rank | Unemployment Among Ages 45 to 54 years |
| Peruvians | 31.5 /100 | #195 | Fair 4.6% |
| Estonians | 31.2 /100 | #196 | Fair 4.6% |
| Albanians | 31.1 /100 | #197 | Fair 4.6% |
| Immigrants | Belarus | 30.6 /100 | #198 | Fair 4.6% |
| Brazilians | 20.1 /100 | #199 | Fair 4.6% |
| Immigrants | Denmark | 19.8 /100 | #200 | Poor 4.6% |
| Immigrants | Costa Rica | 19.7 /100 | #201 | Poor 4.6% |
| Immigrants | Peru | 19.1 /100 | #202 | Poor 4.6% |
| Liberians | 18.7 /100 | #203 | Poor 4.6% |
| Immigrants | Morocco | 16.8 /100 | #204 | Poor 4.6% |
| Immigrants | Greece | 16.2 /100 | #205 | Poor 4.6% |
| Immigrants | Switzerland | 14.0 /100 | #206 | Poor 4.6% |
| Arabs | 13.7 /100 | #207 | Poor 4.6% |
| Immigrants | Africa | 13.6 /100 | #208 | Poor 4.6% |
| Immigrants | Nigeria | 13.3 /100 | #209 | Poor 4.6% |