Native/Alaskan vs Immigrants from Netherlands Unemployment Among Seniors over 65 years

COMPARE

Native/Alaskan
Race
Ancestry
AfghanAfricanAlaska NativeAlaskan AthabascanAlbanianAleutAlsatianAmericanApacheArabArapahoArgentineanArmenianAssyrian/Chaldean/SyriacAustralianAustrianBahamianBangladeshiBarbadianBasqueBelgianBelizeanBermudanBhutaneseBlackfeetBolivianBrazilianBritishBritish West IndianBulgarianBurmeseCajunCambodianCanadianCape VerdeanCarpatho RusynCelticCentral AmericanCentral American IndianCherokeeCheyenneChickasawChileanChineseChippewaChoctawColombianColvilleComancheCosta RicanCreeCreekCroatianCrowCubanCypriotCzechCzechoslovakianDanishDelawareDominicanDutchDutch West IndianEastern EuropeanEcuadorianEgyptianEnglishEstonianEthiopianEuropeanFijianFilipinoFinnishFrenchFrench American IndianFrench CanadianGermanGerman RussianGhanaianGreekGuamanian/ChamorroGuatemalanGuyaneseHaitianHmongHonduranHopiHoumaHungarianIcelanderIndian (Asian)IndonesianInupiatIranianIraqiIrishIroquoisIsraeliItalianJamaicanJapaneseJordanianKenyanKiowaKoreanLaotianLatvianLebaneseLiberianLithuanianLumbeeLuxembourgerMacedonianMalaysianMalteseMarshalleseMenomineeMexicanMexican American IndianMongolianMoroccanNative HawaiianNavajoNepaleseNew ZealanderNicaraguanNigerianNorthern EuropeanNorwegianOkinawanOsageOttawaPaiutePakistaniPalestinianPanamanianParaguayanPennsylvania GermanPeruvianPimaPolishPortuguesePotawatomiPuebloPuerto RicanPuget Sound SalishRomanianRussianSalvadoranSamoanScandinavianScotch-IrishScottishSeminoleSenegaleseSerbianShoshoneSierra LeoneanSiouxSlavicSlovakSloveneSomaliSouth AfricanSouth AmericanSouth American IndianSoviet UnionSpaniardSpanishSpanish AmericanSpanish American IndianSri LankanSubsaharan AfricanSudaneseSwedishSwissSyrianTaiwaneseThaiTlingit-HaidaTohono O'OdhamTonganTrinidadian and TobagonianTsimshianTurkishU.S. Virgin IslanderUgandanUkrainianUruguayanUteVenezuelanVietnameseWelshWest IndianYakamaYaquiYugoslavianYumanYup'ikZimbabwean
Immigration
NonimmigrantsImmigrantsAfghanistanAfricaAlbaniaArgentinaArmeniaAsiaAustraliaAustriaBahamasBangladeshBarbadosBelarusBelgiumBelizeBoliviaBosnia and HerzegovinaBrazilBulgariaBurma/MyanmarCabo VerdeCambodiaCameroonCanadaCaribbeanCentral AmericaChileChinaColombiaCongoCosta RicaCroatiaCubaCzechoslovakiaDenmarkDominicaDominican RepublicEastern AfricaEastern AsiaEastern EuropeEcuadorEgyptEl SalvadorEnglandEritreaEthiopiaEuropeFijiFranceGermanyGhanaGreeceGrenadaGuatemalaGuyanaHaitiHondurasHong KongHungaryIndiaIndonesiaIranIraqIrelandIsraelItalyJamaicaJapanJordanKazakhstanKenyaKoreaKuwaitLaosLatin AmericaLatviaLebanonLiberiaLithuaniaMalaysiaMexicoMicronesiaMiddle AfricaMoldovaMoroccoNepalNicaraguaNigeriaNorth AmericaNorth MacedoniaNorthern AfricaNorthern EuropeNorwayOceaniaPakistanPanamaPeruPhilippinesPolandPortugalRomaniaRussiaSaudi ArabiaScotlandSenegalSerbiaSierra LeoneSingaporeSomaliaSouth AfricaSouth AmericaSouth Central AsiaSouth Eastern AsiaSouthern EuropeSpainSri LankaSt. Vincent and the GrenadinesSudanSwedenSwitzerlandSyriaTaiwanThailandTrinidad and TobagoTurkeyUgandaUkraineUruguayUzbekistanVenezuelaVietnamWest IndiesWestern AfricaWestern AsiaWestern EuropeYemenZaireZimbabweAzores
Immigrants from Netherlands
Race
Ancestry
AfghanAfricanAlaska NativeAlaskan AthabascanAlbanianAleutAlsatianAmericanApacheArabArapahoArgentineanArmenianAssyrian/Chaldean/SyriacAustralianAustrianBahamianBangladeshiBarbadianBasqueBelgianBelizeanBermudanBhutaneseBlackfeetBolivianBrazilianBritishBritish West IndianBulgarianBurmeseCajunCambodianCanadianCape VerdeanCarpatho RusynCelticCentral AmericanCentral American IndianCherokeeCheyenneChickasawChileanChineseChippewaChoctawColombianColvilleComancheCosta RicanCreeCreekCroatianCrowCubanCypriotCzechCzechoslovakianDanishDelawareDominicanDutchDutch West IndianEastern EuropeanEcuadorianEgyptianEnglishEstonianEthiopianEuropeanFijianFilipinoFinnishFrenchFrench American IndianFrench CanadianGermanGerman RussianGhanaianGreekGuamanian/ChamorroGuatemalanGuyaneseHaitianHmongHonduranHopiHoumaHungarianIcelanderIndian (Asian)IndonesianInupiatIranianIraqiIrishIroquoisIsraeliItalianJamaicanJapaneseJordanianKenyanKiowaKoreanLaotianLatvianLebaneseLiberianLithuanianLumbeeLuxembourgerMacedonianMalaysianMalteseMarshalleseMenomineeMexicanMexican American IndianMongolianMoroccanNative HawaiianNavajoNepaleseNew ZealanderNicaraguanNigerianNorthern EuropeanNorwegianOkinawanOsageOttawaPaiutePakistaniPalestinianPanamanianParaguayanPennsylvania GermanPeruvianPimaPolishPortuguesePotawatomiPuebloPuerto RicanPuget Sound SalishRomanianRussianSalvadoranSamoanScandinavianScotch-IrishScottishSeminoleSenegaleseSerbianShoshoneSierra LeoneanSiouxSlavicSlovakSloveneSomaliSouth AfricanSouth AmericanSouth American IndianSoviet UnionSpaniardSpanishSpanish AmericanSpanish American IndianSri LankanSubsaharan AfricanSudaneseSwedishSwissSyrianTaiwaneseThaiTlingit-HaidaTohono O'OdhamTonganTrinidadian and TobagonianTsimshianTurkishU.S. Virgin IslanderUgandanUkrainianUruguayanUteVenezuelanVietnameseWelshWest IndianYakamaYaquiYugoslavianYumanYup'ikZimbabwean
Immigration
NonimmigrantsImmigrantsAfghanistanAfricaAlbaniaArgentinaArmeniaAsiaAustraliaAustriaBahamasBangladeshBarbadosBelarusBelgiumBelizeBoliviaBosnia and HerzegovinaBrazilBulgariaBurma/MyanmarCabo VerdeCambodiaCameroonCanadaCaribbeanCentral AmericaChileChinaColombiaCongoCosta RicaCroatiaCubaCzechoslovakiaDenmarkDominicaDominican RepublicEastern AfricaEastern AsiaEastern EuropeEcuadorEgyptEl SalvadorEnglandEritreaEthiopiaEuropeFijiFranceGermanyGhanaGreeceGrenadaGuatemalaGuyanaHaitiHondurasHong KongHungaryIndiaIndonesiaIranIraqIrelandIsraelItalyJamaicaJapanJordanKazakhstanKenyaKoreaKuwaitLaosLatin AmericaLatviaLebanonLiberiaLithuaniaMalaysiaMexicoMicronesiaMiddle AfricaMoldovaMoroccoNepalNetherlandsNicaraguaNigeriaNorth AmericaNorth MacedoniaNorthern AfricaNorthern EuropeNorwayOceaniaPakistanPanamaPeruPhilippinesPolandPortugalRomaniaRussiaSaudi ArabiaScotlandSenegalSerbiaSierra LeoneSingaporeSomaliaSouth AfricaSouth AmericaSouth Central AsiaSouth Eastern AsiaSouthern EuropeSpainSri LankaSt. Vincent and the GrenadinesSudanSwedenSwitzerlandSyriaTaiwanThailandTrinidad and TobagoTurkeyUgandaUkraineUruguayUzbekistanVenezuelaVietnamWest IndiesWestern AfricaWestern AsiaWestern EuropeYemenZaireZimbabweAzores
Unemployment Among Seniors over 65 years
Income
Poverty
Unemployment
Labor Participation
Family Structure
Vehicle Availability
Education Level
Disability

Unemployment Among Seniors over 65 years Comparison

Natives/Alaskans

Immigrants from Netherlands

Tragic
Exceptional
5.8%
UNEMPLOYMENT AMONG SENIORS OVER 65 YEARS
0.0/ 100
METRIC RATING
322nd/ 347
METRIC RANK
5.0%
UNEMPLOYMENT AMONG SENIORS OVER 65 YEARS
98.8/ 100
METRIC RATING
79th/ 347
METRIC RANK

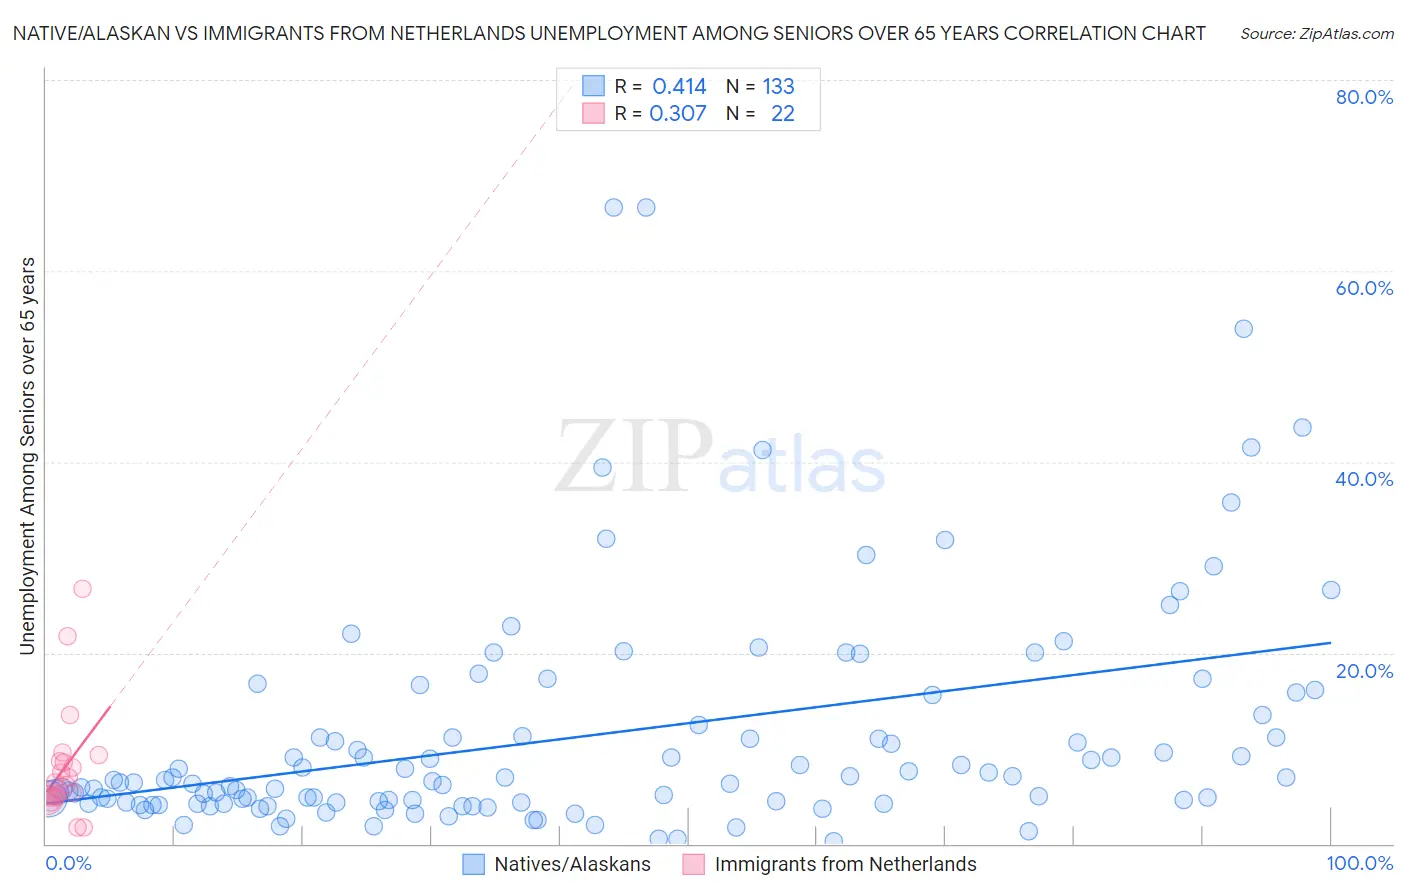
Native/Alaskan vs Immigrants from Netherlands Unemployment Among Seniors over 65 years Correlation Chart

The statistical analysis conducted on geographies consisting of 433,164,375 people shows a moderate positive correlation between the proportion of Natives/Alaskans and unemployment rate amomg seniors over the age of 65 in the United States with a correlation coefficient (R) of 0.414 and weighted average of 5.8%. Similarly, the statistical analysis conducted on geographies consisting of 223,089,911 people shows a mild positive correlation between the proportion of Immigrants from Netherlands and unemployment rate amomg seniors over the age of 65 in the United States with a correlation coefficient (R) of 0.307 and weighted average of 5.0%, a difference of 16.2%.
Native/Alaskan vs Immigrants from Netherlands Unemployment Among Seniors over 65 years

Unemployment Among Seniors over 65 years Correlation Summary

MeasurementNative/AlaskanImmigrants from Netherlands
Minimum0.30%1.7%
Maximum66.6%26.7%
Range66.3%25.0%
Mean11.3%8.0%
Median6.5%6.3%
Interquartile 25% (IQ1)4.3%4.9%
Interquartile 75% (IQ3)12.9%8.7%
Interquartile Range (IQR)8.7%3.8%
Standard Deviation (Sample)12.1%5.9%
Standard Deviation (Population)12.0%5.8%

Similar Demographics by Unemployment Among Seniors over 65 years

Demographics Similar to Natives/Alaskans by Unemployment Among Seniors over 65 years

In terms of unemployment among seniors over 65 years, the demographic groups most similar to Natives/Alaskans are British West Indian (5.8%, a difference of 0.080%), Immigrants from Dominica (5.8%, a difference of 0.34%), Yuman (5.8%, a difference of 0.51%), Immigrants from Mexico (5.7%, a difference of 0.72%), and Immigrants from Bangladesh (5.7%, a difference of 0.88%).
DemographicsRating | RankUnemployment Among Seniors over 65 years
Immigrants | El Salvador
0.0
/100
|
#315
Tragic
5.7%
Immigrants | Central America
0.0
/100
|
#316
Tragic
5.7%
Immigrants | Bahamas
0.0
/100
|
#317
Tragic
5.7%
Vietnamese
0.0
/100
|
#318
Tragic
5.7%
Immigrants | Bangladesh
0.0
/100
|
#319
Tragic
5.7%
Immigrants | Mexico
0.0
/100
|
#320
Tragic
5.7%
British West Indians
0.0
/100
|
#321
Tragic
5.8%
Natives/Alaskans
0.0
/100
|
#322
Tragic
5.8%
Immigrants | Dominica
0.0
/100
|
#323
Tragic
5.8%
Yuman
0.0
/100
|
#324
Tragic
5.8%
Inupiat
0.0
/100
|
#325
Tragic
5.8%
Shoshone
0.0
/100
|
#326
Tragic
5.9%
Bermudans
0.0
/100
|
#327
Tragic
5.9%
Puerto Ricans
0.0
/100
|
#328
Tragic
5.9%
Dominicans
0.0
/100
|
#329
Tragic
6.0%

Demographics Similar to Immigrants from Netherlands by Unemployment Among Seniors over 65 years

In terms of unemployment among seniors over 65 years, the demographic groups most similar to Immigrants from Netherlands are Slavic (5.0%, a difference of 0.050%), Immigrants from Ethiopia (5.0%, a difference of 0.10%), Estonian (5.0%, a difference of 0.19%), Serbian (5.0%, a difference of 0.22%), and Thai (5.0%, a difference of 0.24%).
DemographicsRating | RankUnemployment Among Seniors over 65 years
Nicaraguans
99.3
/100
|
#72
Exceptional
4.9%
Immigrants | Japan
99.2
/100
|
#73
Exceptional
4.9%
Japanese
99.2
/100
|
#74
Exceptional
4.9%
British
99.1
/100
|
#75
Exceptional
4.9%
Welsh
99.1
/100
|
#76
Exceptional
5.0%
Thais
99.1
/100
|
#77
Exceptional
5.0%
Slavs
98.9
/100
|
#78
Exceptional
5.0%
Immigrants | Netherlands
98.8
/100
|
#79
Exceptional
5.0%
Immigrants | Ethiopia
98.6
/100
|
#80
Exceptional
5.0%
Estonians
98.5
/100
|
#81
Exceptional
5.0%
Serbians
98.4
/100
|
#82
Exceptional
5.0%
Immigrants | Zimbabwe
98.3
/100
|
#83
Exceptional
5.0%
Filipinos
98.3
/100
|
#84
Exceptional
5.0%
Immigrants | Hungary
98.2
/100
|
#85
Exceptional
5.0%
Immigrants | Taiwan
98.2
/100
|
#86
Exceptional
5.0%