Native/Alaskan vs Hopi Unemployment Among Seniors over 75 years
COMPARE
Native/Alaskan
Hopi
Unemployment Among Seniors over 75 years
Unemployment Among Seniors over 75 years Comparison
Natives/Alaskans
Hopi
10.2%
UNEMPLOYMENT AMONG SENIORS OVER 75 YEARS
0.0/ 100
METRIC RATING
316th/ 347
METRIC RANK
6.3%
UNEMPLOYMENT AMONG SENIORS OVER 75 YEARS
100.0/ 100
METRIC RATING
5th/ 347
METRIC RANK
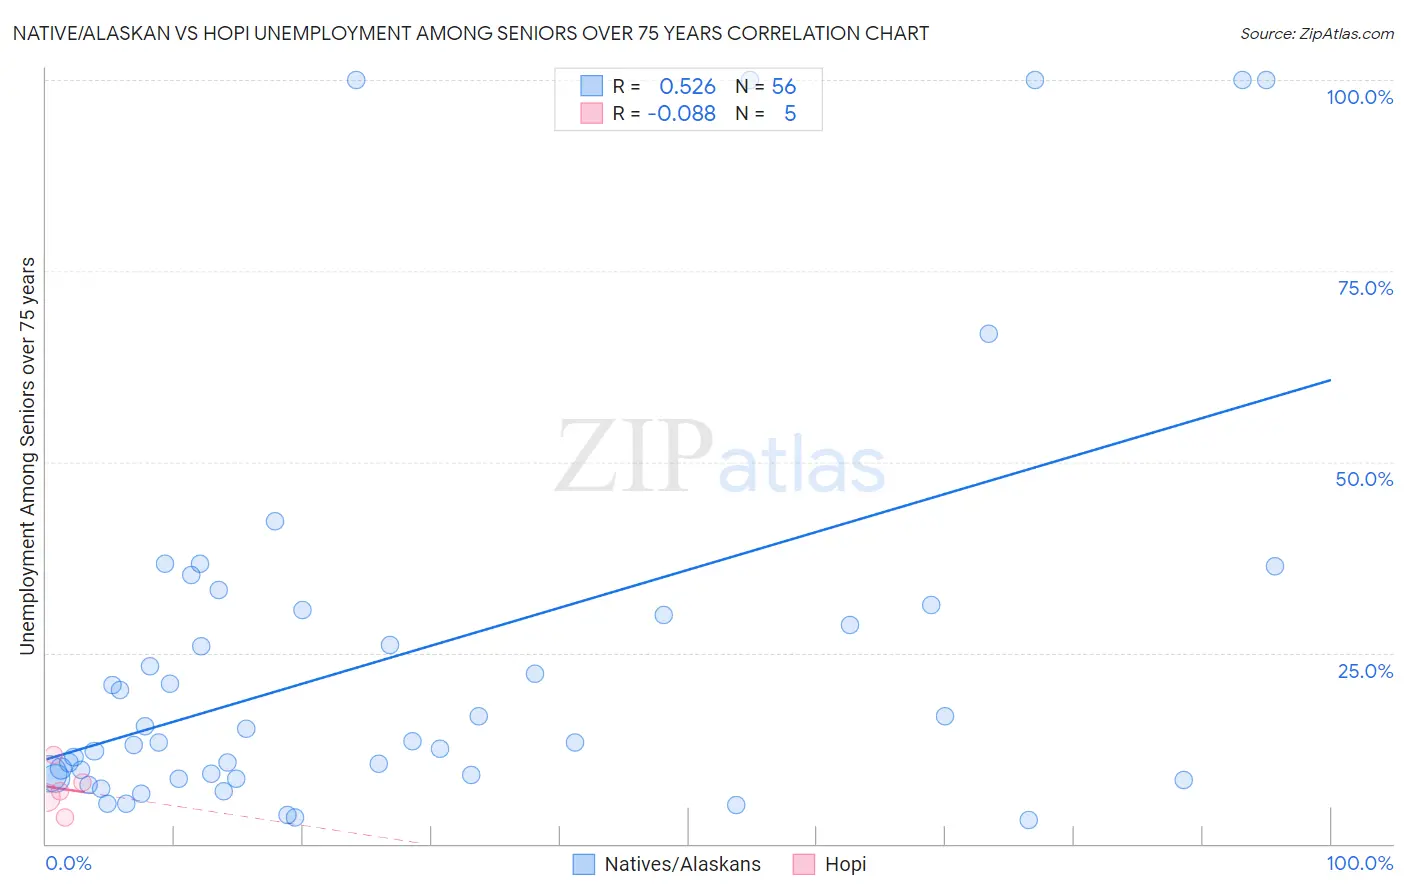
Native/Alaskan vs Hopi Unemployment Among Seniors over 75 years Correlation Chart
The statistical analysis conducted on geographies consisting of 226,317,213 people shows a substantial positive correlation between the proportion of Natives/Alaskans and unemployment rate among seniors over the age of 75 in the United States with a correlation coefficient (R) of 0.526 and weighted average of 10.2%. Similarly, the statistical analysis conducted on geographies consisting of 59,930,816 people shows a slight negative correlation between the proportion of Hopi and unemployment rate among seniors over the age of 75 in the United States with a correlation coefficient (R) of -0.088 and weighted average of 6.3%, a difference of 62.5%.
Unemployment Among Seniors over 75 years Correlation Summary
| Measurement | Native/Alaskan | Hopi |
| Minimum | 3.1% | 3.4% |
| Maximum | 100.0% | 11.7% |
| Range | 96.9% | 8.3% |
| Mean | 24.8% | 7.2% |
| Median | 13.4% | 6.8% |
| Interquartile 25% (IQ1) | 8.8% | 4.7% |
| Interquartile 75% (IQ3) | 30.3% | 9.9% |
| Interquartile Range (IQR) | 21.5% | 5.2% |
| Standard Deviation (Sample) | 26.7% | 3.0% |
| Standard Deviation (Population) | 26.4% | 2.7% |
Similar Demographics by Unemployment Among Seniors over 75 years
Demographics Similar to Natives/Alaskans by Unemployment Among Seniors over 75 years
In terms of unemployment among seniors over 75 years, the demographic groups most similar to Natives/Alaskans are Pennsylvania German (10.2%, a difference of 0.24%), Dutch West Indian (10.2%, a difference of 0.36%), Irish (10.2%, a difference of 0.37%), Liberian (10.2%, a difference of 0.49%), and German (10.3%, a difference of 0.56%).
| Demographics | Rating | Rank | Unemployment Among Seniors over 75 years |
| English | 0.0 /100 | #309 | Tragic 10.1% |
| Hungarians | 0.0 /100 | #310 | Tragic 10.1% |
| Scottish | 0.0 /100 | #311 | Tragic 10.1% |
| Chippewa | 0.0 /100 | #312 | Tragic 10.1% |
| Nepalese | 0.0 /100 | #313 | Tragic 10.1% |
| Dutch West Indians | 0.0 /100 | #314 | Tragic 10.2% |
| Pennsylvania Germans | 0.0 /100 | #315 | Tragic 10.2% |
| Natives/Alaskans | 0.0 /100 | #316 | Tragic 10.2% |
| Irish | 0.0 /100 | #317 | Tragic 10.2% |
| Liberians | 0.0 /100 | #318 | Tragic 10.2% |
| Germans | 0.0 /100 | #319 | Tragic 10.3% |
| French | 0.0 /100 | #320 | Tragic 10.3% |
| Aleuts | 0.0 /100 | #321 | Tragic 10.3% |
| Poles | 0.0 /100 | #322 | Tragic 10.3% |
| Tongans | 0.0 /100 | #323 | Tragic 10.4% |
Demographics Similar to Hopi by Unemployment Among Seniors over 75 years
In terms of unemployment among seniors over 75 years, the demographic groups most similar to Hopi are Alsatian (6.1%, a difference of 2.6%), Immigrants from Armenia (6.5%, a difference of 3.8%), Spanish American Indian (6.5%, a difference of 4.2%), Taiwanese (6.6%, a difference of 4.6%), and Cheyenne (5.9%, a difference of 5.6%).
| Demographics | Rating | Rank | Unemployment Among Seniors over 75 years |
| Crow | 100.0 /100 | #1 | Exceptional 5.9% |
| Chinese | 100.0 /100 | #2 | Exceptional 5.9% |
| Cheyenne | 100.0 /100 | #3 | Exceptional 5.9% |
| Alsatians | 100.0 /100 | #4 | Exceptional 6.1% |
| Hopi | 100.0 /100 | #5 | Exceptional 6.3% |
| Immigrants | Armenia | 100.0 /100 | #6 | Exceptional 6.5% |
| Spanish American Indians | 100.0 /100 | #7 | Exceptional 6.5% |
| Taiwanese | 100.0 /100 | #8 | Exceptional 6.6% |
| Soviet Union | 100.0 /100 | #9 | Exceptional 6.6% |
| Yuman | 100.0 /100 | #10 | Exceptional 6.7% |
| Immigrants | Grenada | 100.0 /100 | #11 | Exceptional 6.7% |
| Comanche | 100.0 /100 | #12 | Exceptional 6.7% |
| Immigrants | Congo | 100.0 /100 | #13 | Exceptional 6.7% |
| Ute | 100.0 /100 | #14 | Exceptional 6.8% |
| Icelanders | 100.0 /100 | #15 | Exceptional 7.0% |