Native Hawaiian vs Immigrants from Western Asia Unemployment Among Seniors over 75 years
COMPARE
Native Hawaiian
Immigrants from Western Asia
Unemployment Among Seniors over 75 years
Unemployment Among Seniors over 75 years Comparison
Native Hawaiians
Immigrants from Western Asia
8.4%
UNEMPLOYMENT AMONG SENIORS OVER 75 YEARS
96.1/ 100
METRIC RATING
128th/ 347
METRIC RANK
9.0%
UNEMPLOYMENT AMONG SENIORS OVER 75 YEARS
12.5/ 100
METRIC RATING
215th/ 347
METRIC RANK
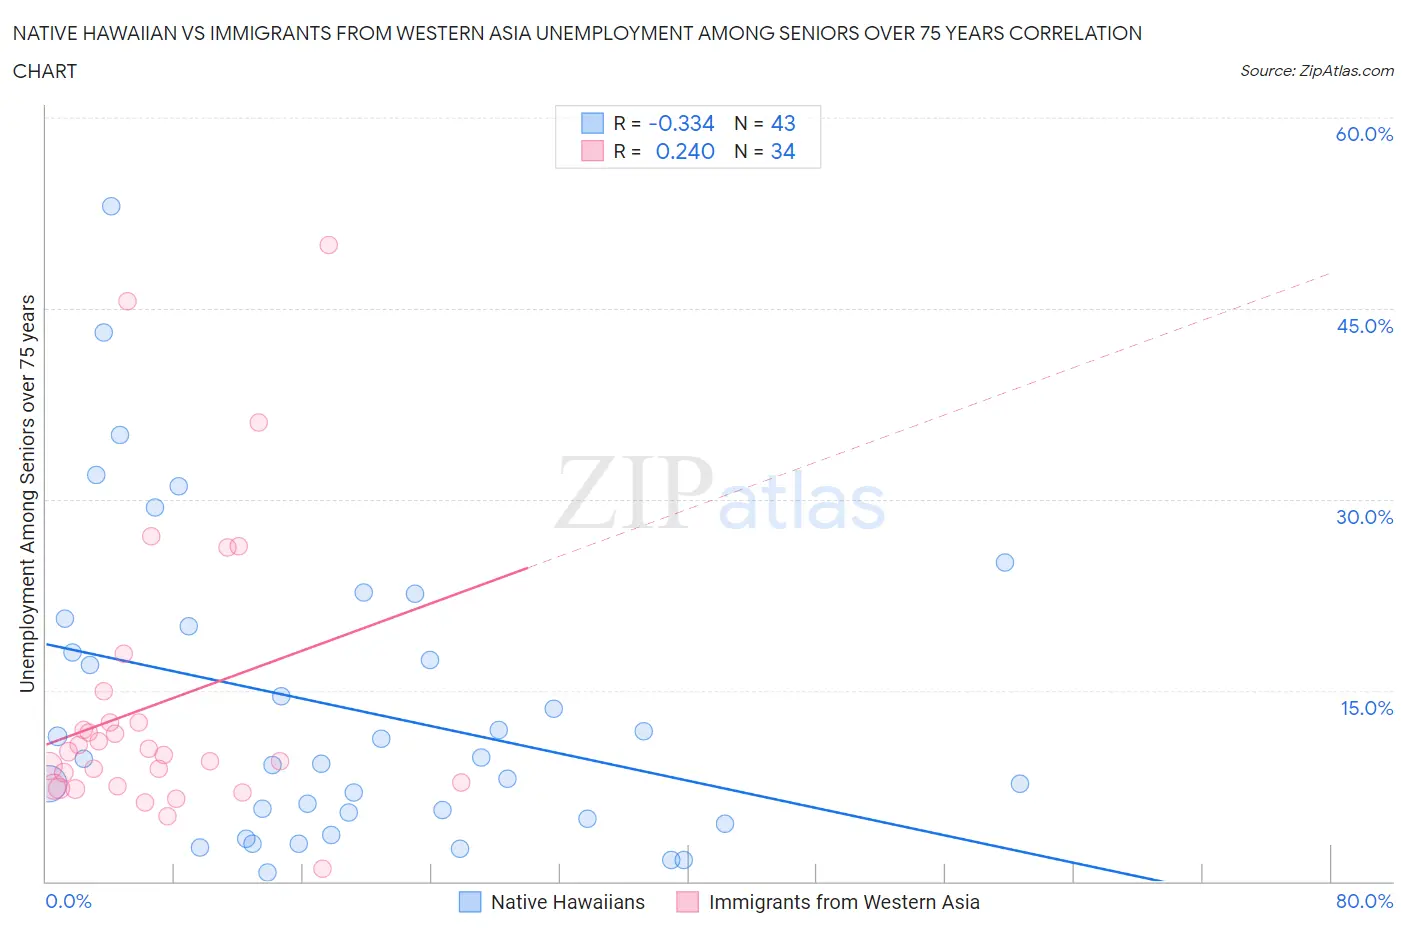
Native Hawaiian vs Immigrants from Western Asia Unemployment Among Seniors over 75 years Correlation Chart
The statistical analysis conducted on geographies consisting of 178,636,916 people shows a mild negative correlation between the proportion of Native Hawaiians and unemployment rate among seniors over the age of 75 in the United States with a correlation coefficient (R) of -0.334 and weighted average of 8.4%. Similarly, the statistical analysis conducted on geographies consisting of 206,828,449 people shows a weak positive correlation between the proportion of Immigrants from Western Asia and unemployment rate among seniors over the age of 75 in the United States with a correlation coefficient (R) of 0.240 and weighted average of 9.0%, a difference of 7.2%.
Unemployment Among Seniors over 75 years Correlation Summary
| Measurement | Native Hawaiian | Immigrants from Western Asia |
| Minimum | 0.70% | 1.0% |
| Maximum | 53.0% | 50.0% |
| Range | 52.3% | 49.0% |
| Mean | 13.6% | 13.9% |
| Median | 9.6% | 10.0% |
| Interquartile 25% (IQ1) | 4.9% | 7.4% |
| Interquartile 75% (IQ3) | 20.0% | 12.5% |
| Interquartile Range (IQR) | 15.1% | 5.0% |
| Standard Deviation (Sample) | 11.9% | 11.2% |
| Standard Deviation (Population) | 11.8% | 11.0% |
Similar Demographics by Unemployment Among Seniors over 75 years
Demographics Similar to Native Hawaiians by Unemployment Among Seniors over 75 years
In terms of unemployment among seniors over 75 years, the demographic groups most similar to Native Hawaiians are Ghanaian (8.4%, a difference of 0.030%), Belizean (8.4%, a difference of 0.050%), Honduran (8.4%, a difference of 0.050%), Immigrants from Moldova (8.3%, a difference of 0.26%), and Thai (8.3%, a difference of 0.28%).
| Demographics | Rating | Rank | Unemployment Among Seniors over 75 years |
| Immigrants | Croatia | 97.2 /100 | #121 | Exceptional 8.3% |
| Immigrants | Russia | 97.1 /100 | #122 | Exceptional 8.3% |
| Immigrants | Nepal | 96.9 /100 | #123 | Exceptional 8.3% |
| Thais | 96.8 /100 | #124 | Exceptional 8.3% |
| Immigrants | Moldova | 96.7 /100 | #125 | Exceptional 8.3% |
| Belizeans | 96.3 /100 | #126 | Exceptional 8.4% |
| Hondurans | 96.2 /100 | #127 | Exceptional 8.4% |
| Native Hawaiians | 96.1 /100 | #128 | Exceptional 8.4% |
| Ghanaians | 96.0 /100 | #129 | Exceptional 8.4% |
| Apache | 95.2 /100 | #130 | Exceptional 8.4% |
| German Russians | 94.9 /100 | #131 | Exceptional 8.4% |
| Chileans | 93.8 /100 | #132 | Exceptional 8.4% |
| Serbians | 93.7 /100 | #133 | Exceptional 8.4% |
| Immigrants | Czechoslovakia | 93.4 /100 | #134 | Exceptional 8.4% |
| Haitians | 91.4 /100 | #135 | Exceptional 8.5% |
Demographics Similar to Immigrants from Western Asia by Unemployment Among Seniors over 75 years
In terms of unemployment among seniors over 75 years, the demographic groups most similar to Immigrants from Western Asia are Immigrants from Oceania (9.0%, a difference of 0.080%), Immigrants from Brazil (9.0%, a difference of 0.090%), Immigrants from Latin America (9.0%, a difference of 0.11%), Romanian (9.0%, a difference of 0.15%), and Lebanese (9.0%, a difference of 0.18%).
| Demographics | Rating | Rank | Unemployment Among Seniors over 75 years |
| Immigrants | Philippines | 15.8 /100 | #208 | Poor 8.9% |
| Salvadorans | 15.4 /100 | #209 | Poor 8.9% |
| Bermudans | 15.0 /100 | #210 | Poor 8.9% |
| Delaware | 14.6 /100 | #211 | Poor 9.0% |
| Romanians | 13.8 /100 | #212 | Poor 9.0% |
| Immigrants | Latin America | 13.4 /100 | #213 | Poor 9.0% |
| Immigrants | Brazil | 13.3 /100 | #214 | Poor 9.0% |
| Immigrants | Western Asia | 12.5 /100 | #215 | Poor 9.0% |
| Immigrants | Oceania | 11.8 /100 | #216 | Poor 9.0% |
| Lebanese | 11.1 /100 | #217 | Poor 9.0% |
| Immigrants | Africa | 9.7 /100 | #218 | Tragic 9.0% |
| Afghans | 8.3 /100 | #219 | Tragic 9.0% |
| Immigrants | Zimbabwe | 7.8 /100 | #220 | Tragic 9.0% |
| Guamanians/Chamorros | 7.7 /100 | #221 | Tragic 9.0% |
| Peruvians | 7.3 /100 | #222 | Tragic 9.0% |