Native Hawaiian vs Brazilian Unemployment Among Ages 25 to 29 years
COMPARE
Native Hawaiian
Brazilian
Unemployment Among Ages 25 to 29 years
Unemployment Among Ages 25 to 29 years Comparison
Native Hawaiians
Brazilians
7.1%
UNEMPLOYMENT AMONG AGES 25 TO 29 YEARS
1.3/ 100
METRIC RATING
240th/ 347
METRIC RANK
6.5%
UNEMPLOYMENT AMONG AGES 25 TO 29 YEARS
81.9/ 100
METRIC RATING
126th/ 347
METRIC RANK
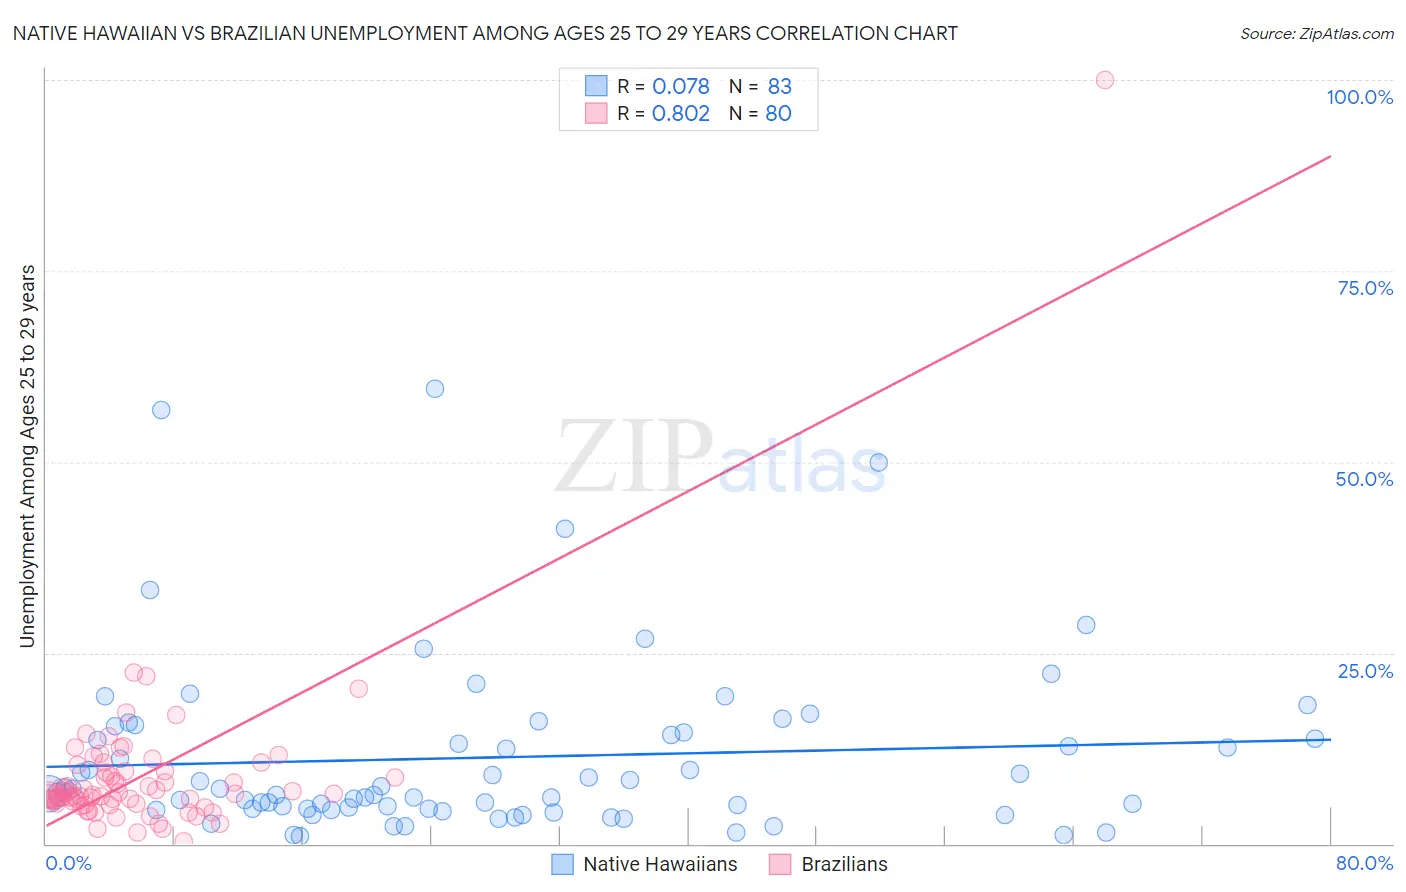
Native Hawaiian vs Brazilian Unemployment Among Ages 25 to 29 years Correlation Chart
The statistical analysis conducted on geographies consisting of 318,544,367 people shows a slight positive correlation between the proportion of Native Hawaiians and unemployment rate among population between the ages 25 and 29 in the United States with a correlation coefficient (R) of 0.078 and weighted average of 7.1%. Similarly, the statistical analysis conducted on geographies consisting of 311,458,460 people shows a very strong positive correlation between the proportion of Brazilians and unemployment rate among population between the ages 25 and 29 in the United States with a correlation coefficient (R) of 0.802 and weighted average of 6.5%, a difference of 9.2%.
Unemployment Among Ages 25 to 29 years Correlation Summary
| Measurement | Native Hawaiian | Brazilian |
| Minimum | 0.90% | 0.40% |
| Maximum | 59.6% | 100.0% |
| Range | 58.7% | 99.6% |
| Mean | 11.3% | 8.8% |
| Median | 6.7% | 6.5% |
| Interquartile 25% (IQ1) | 4.5% | 5.4% |
| Interquartile 75% (IQ3) | 14.5% | 9.5% |
| Interquartile Range (IQR) | 10.0% | 4.0% |
| Standard Deviation (Sample) | 11.6% | 11.2% |
| Standard Deviation (Population) | 11.5% | 11.1% |
Similar Demographics by Unemployment Among Ages 25 to 29 years
Demographics Similar to Native Hawaiians by Unemployment Among Ages 25 to 29 years
In terms of unemployment among ages 25 to 29 years, the demographic groups most similar to Native Hawaiians are Potawatomi (7.1%, a difference of 0.030%), Immigrants from Sierra Leone (7.1%, a difference of 0.040%), Spanish American Indian (7.1%, a difference of 0.30%), Yaqui (7.1%, a difference of 0.43%), and Nonimmigrants (7.1%, a difference of 0.47%).
| Demographics | Rating | Rank | Unemployment Among Ages 25 to 29 years |
| Immigrants | Honduras | 2.4 /100 | #233 | Tragic 7.0% |
| French Canadians | 2.4 /100 | #234 | Tragic 7.0% |
| Panamanians | 2.1 /100 | #235 | Tragic 7.0% |
| Cape Verdeans | 1.9 /100 | #236 | Tragic 7.0% |
| Puget Sound Salish | 1.8 /100 | #237 | Tragic 7.1% |
| Hondurans | 1.8 /100 | #238 | Tragic 7.1% |
| Potawatomi | 1.3 /100 | #239 | Tragic 7.1% |
| Native Hawaiians | 1.3 /100 | #240 | Tragic 7.1% |
| Immigrants | Sierra Leone | 1.3 /100 | #241 | Tragic 7.1% |
| Spanish American Indians | 1.1 /100 | #242 | Tragic 7.1% |
| Yaqui | 1.0 /100 | #243 | Tragic 7.1% |
| Immigrants | Nonimmigrants | 0.9 /100 | #244 | Tragic 7.1% |
| Guatemalans | 0.9 /100 | #245 | Tragic 7.1% |
| Immigrants | Uzbekistan | 0.7 /100 | #246 | Tragic 7.2% |
| Immigrants | Guatemala | 0.7 /100 | #247 | Tragic 7.2% |
Demographics Similar to Brazilians by Unemployment Among Ages 25 to 29 years
In terms of unemployment among ages 25 to 29 years, the demographic groups most similar to Brazilians are Syrian (6.5%, a difference of 0.020%), Arab (6.5%, a difference of 0.060%), Dutch (6.5%, a difference of 0.13%), Immigrants from Chile (6.5%, a difference of 0.15%), and Sri Lankan (6.5%, a difference of 0.17%).
| Demographics | Rating | Rank | Unemployment Among Ages 25 to 29 years |
| Immigrants | South Africa | 84.9 /100 | #119 | Excellent 6.5% |
| Immigrants | Moldova | 84.5 /100 | #120 | Excellent 6.5% |
| Immigrants | Uganda | 84.5 /100 | #121 | Excellent 6.5% |
| Immigrants | Belarus | 83.7 /100 | #122 | Excellent 6.5% |
| Laotians | 83.6 /100 | #123 | Excellent 6.5% |
| Arabs | 82.5 /100 | #124 | Excellent 6.5% |
| Syrians | 82.1 /100 | #125 | Excellent 6.5% |
| Brazilians | 81.9 /100 | #126 | Excellent 6.5% |
| Dutch | 80.6 /100 | #127 | Excellent 6.5% |
| Immigrants | Chile | 80.5 /100 | #128 | Excellent 6.5% |
| Sri Lankans | 80.3 /100 | #129 | Excellent 6.5% |
| Immigrants | Peru | 79.9 /100 | #130 | Good 6.5% |
| Immigrants | Afghanistan | 79.2 /100 | #131 | Good 6.5% |
| Poles | 76.6 /100 | #132 | Good 6.5% |
| Immigrants | Europe | 75.7 /100 | #133 | Good 6.5% |