Moroccan vs Paraguayan Unemployment
COMPARE
Moroccan
Paraguayan
Unemployment
Unemployment Comparison
Moroccans
Paraguayans
5.5%
UNEMPLOYMENT
3.2/ 100
METRIC RATING
237th/ 347
METRIC RANK
4.9%
UNEMPLOYMENT
98.3/ 100
METRIC RATING
73rd/ 347
METRIC RANK
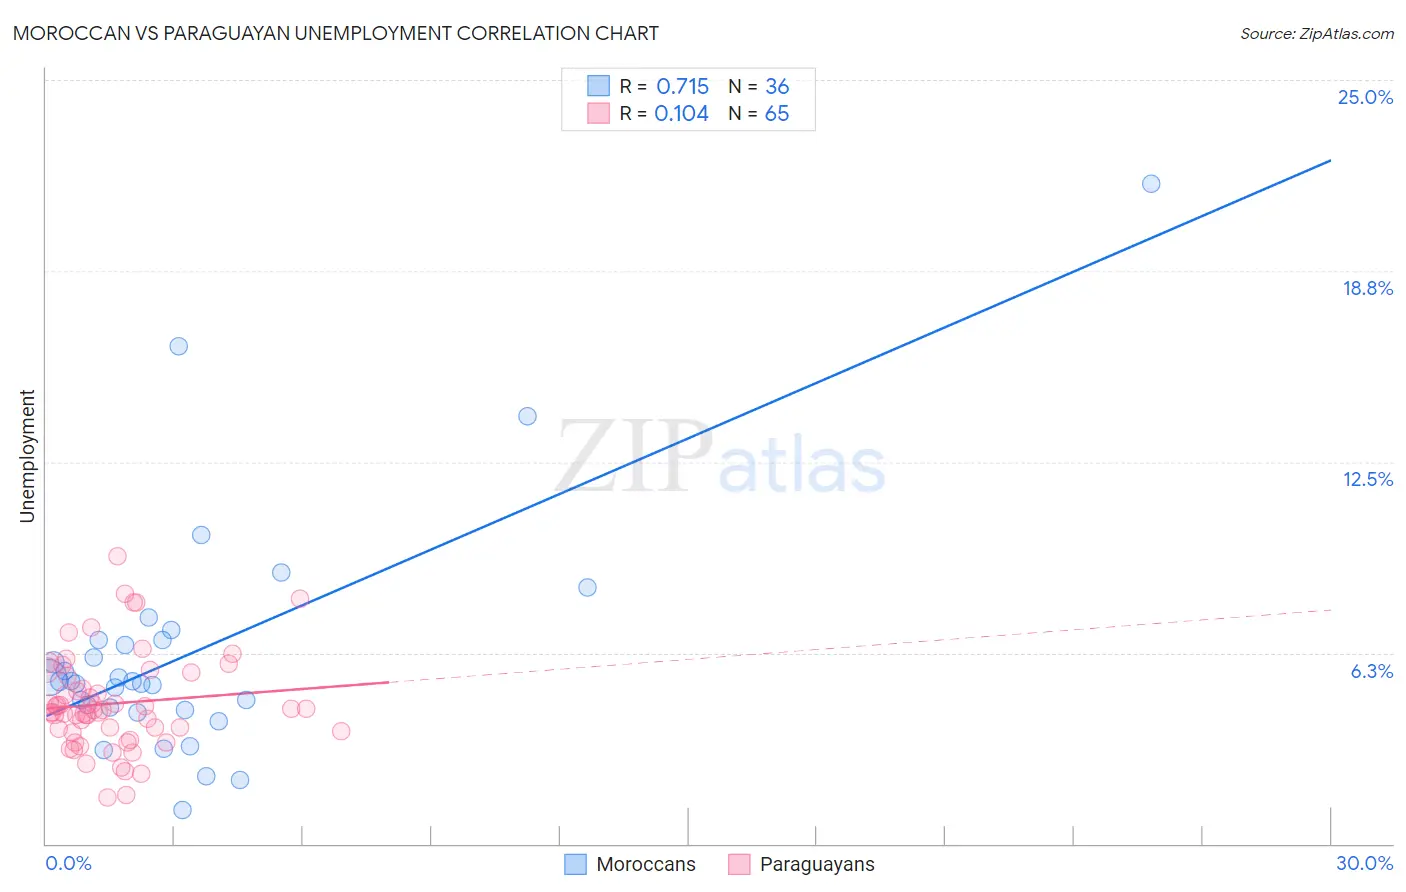
Moroccan vs Paraguayan Unemployment Correlation Chart
The statistical analysis conducted on geographies consisting of 201,766,508 people shows a strong positive correlation between the proportion of Moroccans and unemployment in the United States with a correlation coefficient (R) of 0.715 and weighted average of 5.5%. Similarly, the statistical analysis conducted on geographies consisting of 95,099,776 people shows a poor positive correlation between the proportion of Paraguayans and unemployment in the United States with a correlation coefficient (R) of 0.104 and weighted average of 4.9%, a difference of 12.2%.
Unemployment Correlation Summary
| Measurement | Moroccan | Paraguayan |
| Minimum | 1.1% | 1.5% |
| Maximum | 21.6% | 9.4% |
| Range | 20.5% | 7.9% |
| Mean | 6.2% | 4.6% |
| Median | 5.3% | 4.4% |
| Interquartile 25% (IQ1) | 4.4% | 3.7% |
| Interquartile 75% (IQ3) | 6.7% | 5.5% |
| Interquartile Range (IQR) | 2.3% | 1.9% |
| Standard Deviation (Sample) | 4.0% | 1.6% |
| Standard Deviation (Population) | 3.9% | 1.6% |
Similar Demographics by Unemployment
Demographics Similar to Moroccans by Unemployment
In terms of unemployment, the demographic groups most similar to Moroccans are Immigrants from Cambodia (5.5%, a difference of 0.060%), Immigrants from Panama (5.5%, a difference of 0.090%), Immigrants from Western Asia (5.5%, a difference of 0.21%), Immigrants (5.5%, a difference of 0.29%), and Cree (5.6%, a difference of 0.31%).
| Demographics | Rating | Rank | Unemployment |
| Ottawa | 5.4 /100 | #230 | Tragic 5.5% |
| Immigrants | Africa | 4.9 /100 | #231 | Tragic 5.5% |
| Comanche | 4.9 /100 | #232 | Tragic 5.5% |
| Immigrants | Syria | 4.8 /100 | #233 | Tragic 5.5% |
| Panamanians | 4.7 /100 | #234 | Tragic 5.5% |
| Immigrants | Panama | 3.4 /100 | #235 | Tragic 5.5% |
| Immigrants | Cambodia | 3.3 /100 | #236 | Tragic 5.5% |
| Moroccans | 3.2 /100 | #237 | Tragic 5.5% |
| Immigrants | Western Asia | 2.8 /100 | #238 | Tragic 5.5% |
| Immigrants | Immigrants | 2.6 /100 | #239 | Tragic 5.5% |
| Cree | 2.6 /100 | #240 | Tragic 5.6% |
| Tlingit-Haida | 2.0 /100 | #241 | Tragic 5.6% |
| Spanish Americans | 2.0 /100 | #242 | Tragic 5.6% |
| Marshallese | 1.3 /100 | #243 | Tragic 5.6% |
| Dutch West Indians | 1.2 /100 | #244 | Tragic 5.6% |
Demographics Similar to Paraguayans by Unemployment
In terms of unemployment, the demographic groups most similar to Paraguayans are Burmese (4.9%, a difference of 0.040%), Immigrants from Japan (4.9%, a difference of 0.070%), Immigrants from Northern Europe (4.9%, a difference of 0.090%), Serbian (4.9%, a difference of 0.12%), and Turkish (4.9%, a difference of 0.23%).
| Demographics | Rating | Rank | Unemployment |
| Slovaks | 98.7 /100 | #66 | Exceptional 4.9% |
| New Zealanders | 98.6 /100 | #67 | Exceptional 4.9% |
| Slavs | 98.6 /100 | #68 | Exceptional 4.9% |
| Immigrants | North America | 98.5 /100 | #69 | Exceptional 4.9% |
| Serbians | 98.4 /100 | #70 | Exceptional 4.9% |
| Immigrants | Japan | 98.3 /100 | #71 | Exceptional 4.9% |
| Burmese | 98.3 /100 | #72 | Exceptional 4.9% |
| Paraguayans | 98.3 /100 | #73 | Exceptional 4.9% |
| Immigrants | Northern Europe | 98.2 /100 | #74 | Exceptional 4.9% |
| Turks | 98.0 /100 | #75 | Exceptional 4.9% |
| German Russians | 98.0 /100 | #76 | Exceptional 4.9% |
| Cypriots | 97.9 /100 | #77 | Exceptional 4.9% |
| Okinawans | 97.9 /100 | #78 | Exceptional 4.9% |
| Canadians | 97.7 /100 | #79 | Exceptional 5.0% |
| Immigrants | Sweden | 97.6 /100 | #80 | Exceptional 5.0% |