Moroccan vs Immigrants from Ghana Unemployment Among Ages 25 to 29 years
COMPARE
Moroccan
Immigrants from Ghana
Unemployment Among Ages 25 to 29 years
Unemployment Among Ages 25 to 29 years Comparison
Moroccans
Immigrants from Ghana
6.7%
UNEMPLOYMENT AMONG AGES 25 TO 29 YEARS
35.9/ 100
METRIC RATING
185th/ 347
METRIC RANK
7.5%
UNEMPLOYMENT AMONG AGES 25 TO 29 YEARS
0.0/ 100
METRIC RATING
275th/ 347
METRIC RANK
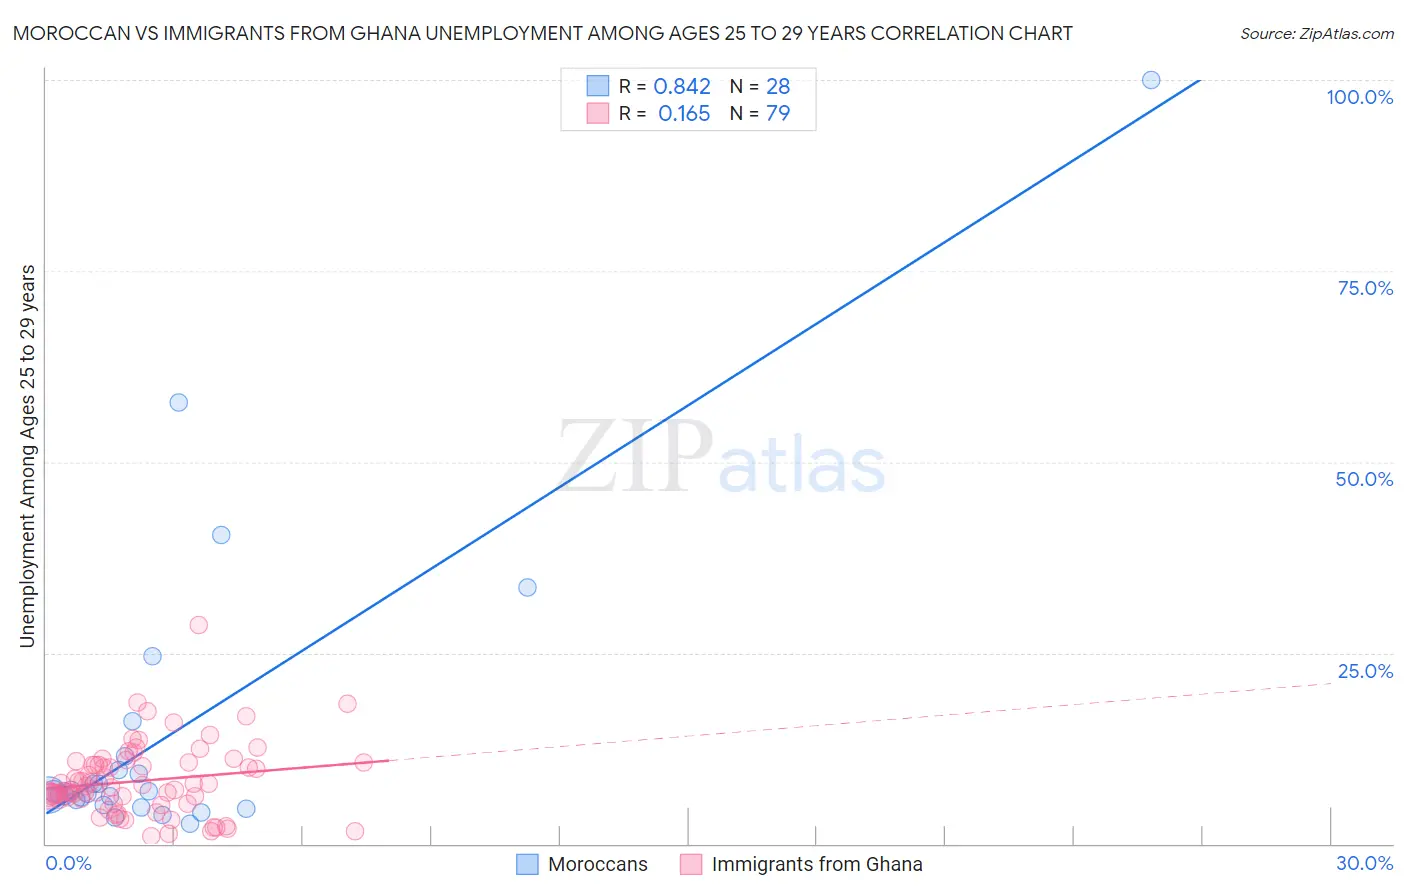
Moroccan vs Immigrants from Ghana Unemployment Among Ages 25 to 29 years Correlation Chart
The statistical analysis conducted on geographies consisting of 198,257,019 people shows a very strong positive correlation between the proportion of Moroccans and unemployment rate among population between the ages 25 and 29 in the United States with a correlation coefficient (R) of 0.842 and weighted average of 6.7%. Similarly, the statistical analysis conducted on geographies consisting of 195,845,619 people shows a poor positive correlation between the proportion of Immigrants from Ghana and unemployment rate among population between the ages 25 and 29 in the United States with a correlation coefficient (R) of 0.165 and weighted average of 7.5%, a difference of 11.6%.
Unemployment Among Ages 25 to 29 years Correlation Summary
| Measurement | Moroccan | Immigrants from Ghana |
| Minimum | 2.7% | 0.96% |
| Maximum | 100.0% | 28.7% |
| Range | 97.3% | 27.7% |
| Mean | 14.7% | 8.2% |
| Median | 6.8% | 7.3% |
| Interquartile 25% (IQ1) | 5.4% | 5.8% |
| Interquartile 75% (IQ3) | 10.5% | 10.6% |
| Interquartile Range (IQR) | 5.1% | 4.7% |
| Standard Deviation (Sample) | 21.0% | 4.7% |
| Standard Deviation (Population) | 20.6% | 4.6% |
Similar Demographics by Unemployment Among Ages 25 to 29 years
Demographics Similar to Moroccans by Unemployment Among Ages 25 to 29 years
In terms of unemployment among ages 25 to 29 years, the demographic groups most similar to Moroccans are Immigrants from Iran (6.7%, a difference of 0.10%), Immigrants from Costa Rica (6.7%, a difference of 0.16%), Immigrants from South America (6.7%, a difference of 0.19%), Irish (6.7%, a difference of 0.21%), and Immigrants from Scotland (6.7%, a difference of 0.25%).
| Demographics | Rating | Rank | Unemployment Among Ages 25 to 29 years |
| Immigrants | Iraq | 45.1 /100 | #178 | Average 6.7% |
| Costa Ricans | 44.9 /100 | #179 | Average 6.7% |
| Immigrants | Africa | 41.1 /100 | #180 | Average 6.7% |
| Immigrants | Western Europe | 41.1 /100 | #181 | Average 6.7% |
| Czechoslovakians | 40.7 /100 | #182 | Average 6.7% |
| Immigrants | Scotland | 39.6 /100 | #183 | Fair 6.7% |
| Immigrants | Costa Rica | 38.3 /100 | #184 | Fair 6.7% |
| Moroccans | 35.9 /100 | #185 | Fair 6.7% |
| Immigrants | Iran | 34.4 /100 | #186 | Fair 6.7% |
| Immigrants | South America | 33.0 /100 | #187 | Fair 6.7% |
| Irish | 32.8 /100 | #188 | Fair 6.7% |
| Argentineans | 32.1 /100 | #189 | Fair 6.7% |
| Koreans | 29.3 /100 | #190 | Fair 6.7% |
| Chickasaw | 28.7 /100 | #191 | Fair 6.7% |
| Immigrants | Ukraine | 28.6 /100 | #192 | Fair 6.7% |
Demographics Similar to Immigrants from Ghana by Unemployment Among Ages 25 to 29 years
In terms of unemployment among ages 25 to 29 years, the demographic groups most similar to Immigrants from Ghana are Immigrants from Central America (7.5%, a difference of 0.080%), Immigrants from Nigeria (7.5%, a difference of 0.29%), Immigrants from Bahamas (7.5%, a difference of 0.32%), French American Indian (7.5%, a difference of 0.34%), and Choctaw (7.5%, a difference of 0.37%).
| Demographics | Rating | Rank | Unemployment Among Ages 25 to 29 years |
| Immigrants | Ecuador | 0.1 /100 | #268 | Tragic 7.4% |
| Immigrants | Latin America | 0.1 /100 | #269 | Tragic 7.4% |
| Bahamians | 0.0 /100 | #270 | Tragic 7.5% |
| Choctaw | 0.0 /100 | #271 | Tragic 7.5% |
| Immigrants | Bahamas | 0.0 /100 | #272 | Tragic 7.5% |
| Immigrants | Nigeria | 0.0 /100 | #273 | Tragic 7.5% |
| Immigrants | Central America | 0.0 /100 | #274 | Tragic 7.5% |
| Immigrants | Ghana | 0.0 /100 | #275 | Tragic 7.5% |
| French American Indians | 0.0 /100 | #276 | Tragic 7.5% |
| Iroquois | 0.0 /100 | #277 | Tragic 7.5% |
| Mexicans | 0.0 /100 | #278 | Tragic 7.5% |
| Nepalese | 0.0 /100 | #279 | Tragic 7.5% |
| Immigrants | Caribbean | 0.0 /100 | #280 | Tragic 7.5% |
| Immigrants | Bangladesh | 0.0 /100 | #281 | Tragic 7.5% |
| Immigrants | Senegal | 0.0 /100 | #282 | Tragic 7.6% |