Mongolian vs South African Unemployment
COMPARE
Mongolian
South African
Unemployment
Unemployment Comparison
Mongolians
South Africans
5.0%
UNEMPLOYMENT
94.8/ 100
METRIC RATING
99th/ 347
METRIC RANK
5.1%
UNEMPLOYMENT
92.6/ 100
METRIC RATING
112th/ 347
METRIC RANK
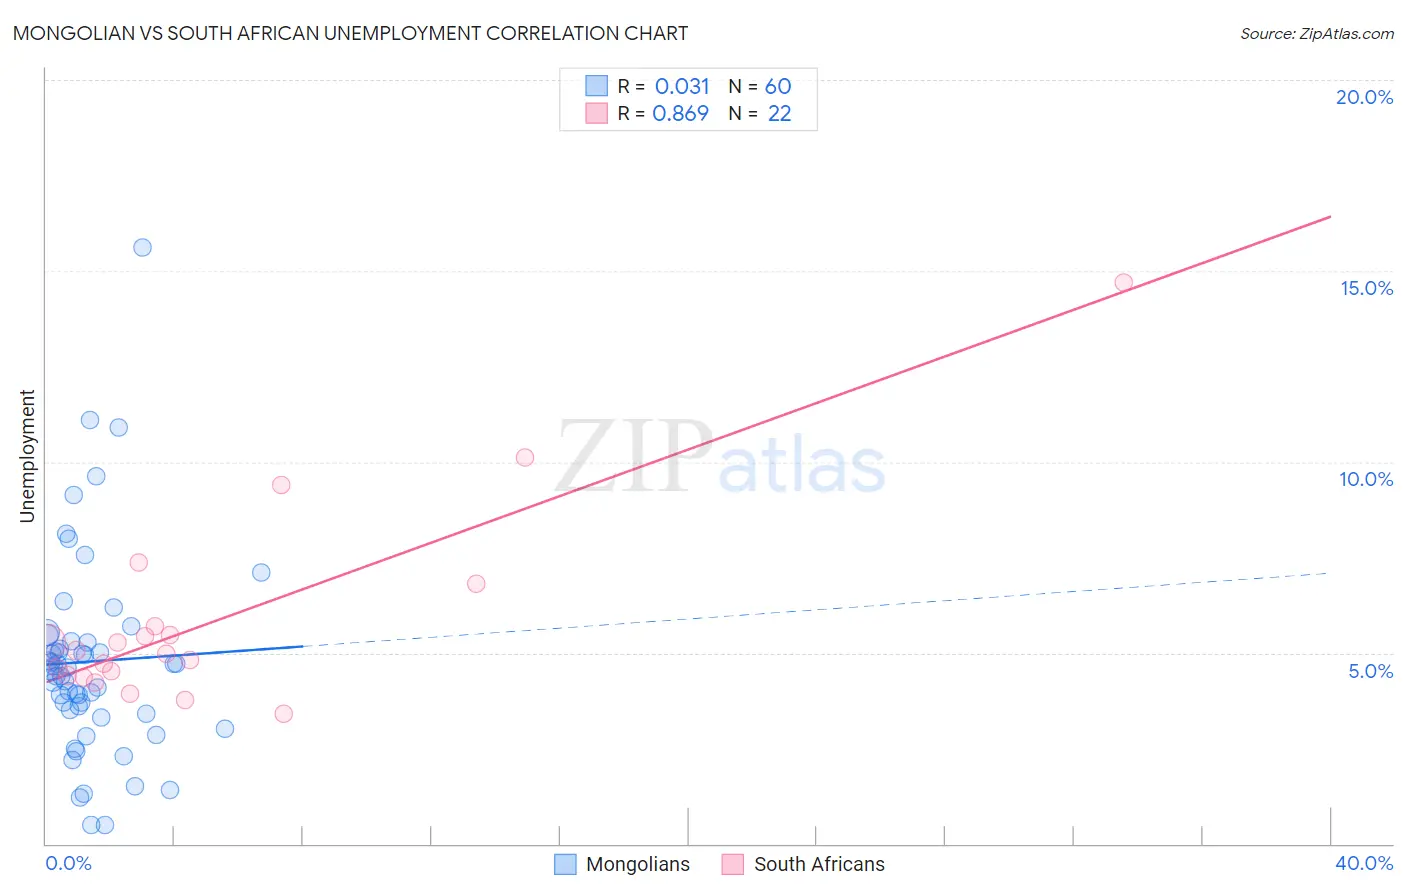
Mongolian vs South African Unemployment Correlation Chart
The statistical analysis conducted on geographies consisting of 140,354,726 people shows no correlation between the proportion of Mongolians and unemployment in the United States with a correlation coefficient (R) of 0.031 and weighted average of 5.0%. Similarly, the statistical analysis conducted on geographies consisting of 182,514,846 people shows a very strong positive correlation between the proportion of South Africans and unemployment in the United States with a correlation coefficient (R) of 0.869 and weighted average of 5.1%, a difference of 0.60%.
Unemployment Correlation Summary
| Measurement | Mongolian | South African |
| Minimum | 0.50% | 3.4% |
| Maximum | 15.6% | 14.7% |
| Range | 15.1% | 11.3% |
| Mean | 4.8% | 5.8% |
| Median | 4.6% | 5.0% |
| Interquartile 25% (IQ1) | 3.5% | 4.4% |
| Interquartile 75% (IQ3) | 5.3% | 5.7% |
| Interquartile Range (IQR) | 1.8% | 1.3% |
| Standard Deviation (Sample) | 2.6% | 2.6% |
| Standard Deviation (Population) | 2.6% | 2.5% |
Demographics Similar to Mongolians and South Africans by Unemployment
In terms of unemployment, the demographic groups most similar to Mongolians are Estonian (5.0%, a difference of 0.060%), Romanian (5.0%, a difference of 0.070%), Immigrants from Czechoslovakia (5.0%, a difference of 0.10%), Immigrants from England (5.0%, a difference of 0.13%), and American (5.0%, a difference of 0.15%). Similarly, the demographic groups most similar to South Africans are Argentinean (5.1%, a difference of 0.040%), Immigrants from Ireland (5.1%, a difference of 0.10%), Immigrants from Lithuania (5.0%, a difference of 0.16%), Chilean (5.0%, a difference of 0.16%), and Immigrants from Eritrea (5.0%, a difference of 0.18%).
| Demographics | Rating | Rank | Unemployment |
| Immigrants | Serbia | 95.6 /100 | #95 | Exceptional 5.0% |
| Immigrants | England | 95.2 /100 | #96 | Exceptional 5.0% |
| Immigrants | Czechoslovakia | 95.1 /100 | #97 | Exceptional 5.0% |
| Romanians | 95.0 /100 | #98 | Exceptional 5.0% |
| Mongolians | 94.8 /100 | #99 | Exceptional 5.0% |
| Estonians | 94.6 /100 | #100 | Exceptional 5.0% |
| Americans | 94.3 /100 | #101 | Exceptional 5.0% |
| Immigrants | Argentina | 94.1 /100 | #102 | Exceptional 5.0% |
| Chickasaw | 94.0 /100 | #103 | Exceptional 5.0% |
| Osage | 94.0 /100 | #104 | Exceptional 5.0% |
| Maltese | 94.0 /100 | #105 | Exceptional 5.0% |
| Immigrants | Romania | 93.7 /100 | #106 | Exceptional 5.0% |
| Immigrants | Turkey | 93.7 /100 | #107 | Exceptional 5.0% |
| Immigrants | Kuwait | 93.7 /100 | #108 | Exceptional 5.0% |
| Immigrants | Eritrea | 93.3 /100 | #109 | Exceptional 5.0% |
| Immigrants | Lithuania | 93.2 /100 | #110 | Exceptional 5.0% |
| Chileans | 93.2 /100 | #111 | Exceptional 5.0% |
| South Africans | 92.6 /100 | #112 | Exceptional 5.1% |
| Argentineans | 92.4 /100 | #113 | Exceptional 5.1% |
| Immigrants | Ireland | 92.1 /100 | #114 | Exceptional 5.1% |
| Immigrants | Western Europe | 91.1 /100 | #115 | Exceptional 5.1% |