Mongolian vs Scotch-Irish Unemployment Among Ages 30 to 34 years

COMPARE

Mongolian
Race
Ancestry
AfghanAfricanAlaska NativeAlaskan AthabascanAlbanianAleutAlsatianAmericanApacheArabArapahoArgentineanArmenianAssyrian/Chaldean/SyriacAustralianAustrianBahamianBangladeshiBarbadianBasqueBelgianBelizeanBermudanBhutaneseBlackfeetBolivianBrazilianBritishBritish West IndianBulgarianBurmeseCajunCambodianCanadianCape VerdeanCarpatho RusynCelticCentral AmericanCentral American IndianCherokeeCheyenneChickasawChileanChineseChippewaChoctawColombianColvilleComancheCosta RicanCreeCreekCroatianCrowCubanCypriotCzechCzechoslovakianDanishDelawareDominicanDutchDutch West IndianEastern EuropeanEcuadorianEgyptianEnglishEstonianEthiopianEuropeanFijianFilipinoFinnishFrenchFrench American IndianFrench CanadianGermanGerman RussianGhanaianGreekGuamanian/ChamorroGuatemalanGuyaneseHaitianHmongHonduranHopiHoumaHungarianIcelanderIndian (Asian)IndonesianInupiatIranianIraqiIrishIroquoisIsraeliItalianJamaicanJapaneseJordanianKenyanKiowaKoreanLaotianLatvianLebaneseLiberianLithuanianLumbeeLuxembourgerMacedonianMalaysianMalteseMarshalleseMenomineeMexicanMexican American IndianMongolianMoroccanNative HawaiianNavajoNepaleseNew ZealanderNicaraguanNigerianNorthern EuropeanNorwegianOkinawanOsageOttawaPaiutePakistaniPalestinianPanamanianParaguayanPennsylvania GermanPeruvianPimaPolishPortuguesePotawatomiPuebloPuerto RicanPuget Sound SalishRomanianRussianSalvadoranSamoanScandinavianScottishSeminoleSenegaleseSerbianShoshoneSierra LeoneanSiouxSlavicSlovakSloveneSomaliSouth AfricanSouth AmericanSouth American IndianSoviet UnionSpaniardSpanishSpanish AmericanSpanish American IndianSri LankanSubsaharan AfricanSudaneseSwedishSwissSyrianTaiwaneseThaiTlingit-HaidaTohono O'OdhamTonganTrinidadian and TobagonianTsimshianTurkishU.S. Virgin IslanderUgandanUkrainianUruguayanUteVenezuelanVietnameseWelshWest IndianYakamaYaquiYugoslavianYumanYup'ikZimbabwean
Immigration
NonimmigrantsImmigrantsAfghanistanAfricaAlbaniaArgentinaArmeniaAsiaAustraliaAustriaBahamasBangladeshBarbadosBelarusBelgiumBelizeBoliviaBosnia and HerzegovinaBrazilBulgariaBurma/MyanmarCabo VerdeCambodiaCameroonCanadaCaribbeanCentral AmericaChileChinaColombiaCongoCosta RicaCroatiaCubaCzechoslovakiaDenmarkDominicaDominican RepublicEastern AfricaEastern AsiaEastern EuropeEcuadorEgyptEl SalvadorEnglandEritreaEthiopiaEuropeFijiFranceGermanyGhanaGreeceGrenadaGuatemalaGuyanaHaitiHondurasHong KongHungaryIndiaIndonesiaIranIraqIrelandIsraelItalyJamaicaJapanJordanKazakhstanKenyaKoreaKuwaitLaosLatin AmericaLatviaLebanonLiberiaLithuaniaMalaysiaMexicoMicronesiaMiddle AfricaMoldovaMoroccoNepalNetherlandsNicaraguaNigeriaNorth AmericaNorth MacedoniaNorthern AfricaNorthern EuropeNorwayOceaniaPakistanPanamaPeruPhilippinesPolandPortugalRomaniaRussiaSaudi ArabiaScotlandSenegalSerbiaSierra LeoneSingaporeSomaliaSouth AfricaSouth AmericaSouth Central AsiaSouth Eastern AsiaSouthern EuropeSpainSri LankaSt. Vincent and the GrenadinesSudanSwedenSwitzerlandSyriaTaiwanThailandTrinidad and TobagoTurkeyUgandaUkraineUruguayUzbekistanVenezuelaVietnamWest IndiesWestern AfricaWestern AsiaWestern EuropeYemenZaireZimbabweAzores
Scotch-Irish
Race
Ancestry
AfghanAfricanAlaska NativeAlaskan AthabascanAlbanianAleutAlsatianAmericanApacheArabArapahoArgentineanArmenianAssyrian/Chaldean/SyriacAustralianAustrianBahamianBangladeshiBarbadianBasqueBelgianBelizeanBermudanBhutaneseBlackfeetBolivianBrazilianBritishBritish West IndianBulgarianBurmeseCajunCambodianCanadianCape VerdeanCarpatho RusynCelticCentral AmericanCentral American IndianCherokeeCheyenneChickasawChileanChineseChippewaChoctawColombianColvilleComancheCosta RicanCreeCreekCroatianCrowCubanCypriotCzechCzechoslovakianDanishDelawareDominicanDutchDutch West IndianEastern EuropeanEcuadorianEgyptianEnglishEstonianEthiopianEuropeanFijianFilipinoFinnishFrenchFrench American IndianFrench CanadianGermanGerman RussianGhanaianGreekGuamanian/ChamorroGuatemalanGuyaneseHaitianHmongHonduranHopiHoumaHungarianIcelanderIndian (Asian)IndonesianInupiatIranianIraqiIrishIroquoisIsraeliItalianJamaicanJapaneseJordanianKenyanKiowaKoreanLaotianLatvianLebaneseLiberianLithuanianLumbeeLuxembourgerMacedonianMalaysianMalteseMarshalleseMenomineeMexicanMexican American IndianMoroccanNative HawaiianNavajoNepaleseNew ZealanderNicaraguanNigerianNorthern EuropeanNorwegianOkinawanOsageOttawaPaiutePakistaniPalestinianPanamanianParaguayanPennsylvania GermanPeruvianPimaPolishPortuguesePotawatomiPuebloPuerto RicanPuget Sound SalishRomanianRussianSalvadoranSamoanScandinavianScotch-IrishScottishSeminoleSenegaleseSerbianShoshoneSierra LeoneanSiouxSlavicSlovakSloveneSomaliSouth AfricanSouth AmericanSouth American IndianSoviet UnionSpaniardSpanishSpanish AmericanSpanish American IndianSri LankanSubsaharan AfricanSudaneseSwedishSwissSyrianTaiwaneseThaiTlingit-HaidaTohono O'OdhamTonganTrinidadian and TobagonianTsimshianTurkishU.S. Virgin IslanderUgandanUkrainianUruguayanUteVenezuelanVietnameseWelshWest IndianYakamaYaquiYugoslavianYumanYup'ikZimbabwean
Immigration
NonimmigrantsImmigrantsAfghanistanAfricaAlbaniaArgentinaArmeniaAsiaAustraliaAustriaBahamasBangladeshBarbadosBelarusBelgiumBelizeBoliviaBosnia and HerzegovinaBrazilBulgariaBurma/MyanmarCabo VerdeCambodiaCameroonCanadaCaribbeanCentral AmericaChileChinaColombiaCongoCosta RicaCroatiaCubaCzechoslovakiaDenmarkDominicaDominican RepublicEastern AfricaEastern AsiaEastern EuropeEcuadorEgyptEl SalvadorEnglandEritreaEthiopiaEuropeFijiFranceGermanyGhanaGreeceGrenadaGuatemalaGuyanaHaitiHondurasHong KongHungaryIndiaIndonesiaIranIraqIrelandIsraelItalyJamaicaJapanJordanKazakhstanKenyaKoreaKuwaitLaosLatin AmericaLatviaLebanonLiberiaLithuaniaMalaysiaMexicoMicronesiaMiddle AfricaMoldovaMoroccoNepalNetherlandsNicaraguaNigeriaNorth AmericaNorth MacedoniaNorthern AfricaNorthern EuropeNorwayOceaniaPakistanPanamaPeruPhilippinesPolandPortugalRomaniaRussiaSaudi ArabiaScotlandSenegalSerbiaSierra LeoneSingaporeSomaliaSouth AfricaSouth AmericaSouth Central AsiaSouth Eastern AsiaSouthern EuropeSpainSri LankaSt. Vincent and the GrenadinesSudanSwedenSwitzerlandSyriaTaiwanThailandTrinidad and TobagoTurkeyUgandaUkraineUruguayUzbekistanVenezuelaVietnamWest IndiesWestern AfricaWestern AsiaWestern EuropeYemenZaireZimbabweAzores
Unemployment Among Ages 30 to 34 years
Income
Poverty
Unemployment
Labor Participation
Family Structure
Vehicle Availability
Education Level
Disability

Unemployment Among Ages 30 to 34 years Comparison

Mongolians

Scotch-Irish

Exceptional
Tragic
5.2%
UNEMPLOYMENT AMONG AGES 30 TO 34 YEARS
91.7/ 100
METRIC RATING
96th/ 347
METRIC RANK
5.7%
UNEMPLOYMENT AMONG AGES 30 TO 34 YEARS
8.6/ 100
METRIC RATING
212th/ 347
METRIC RANK

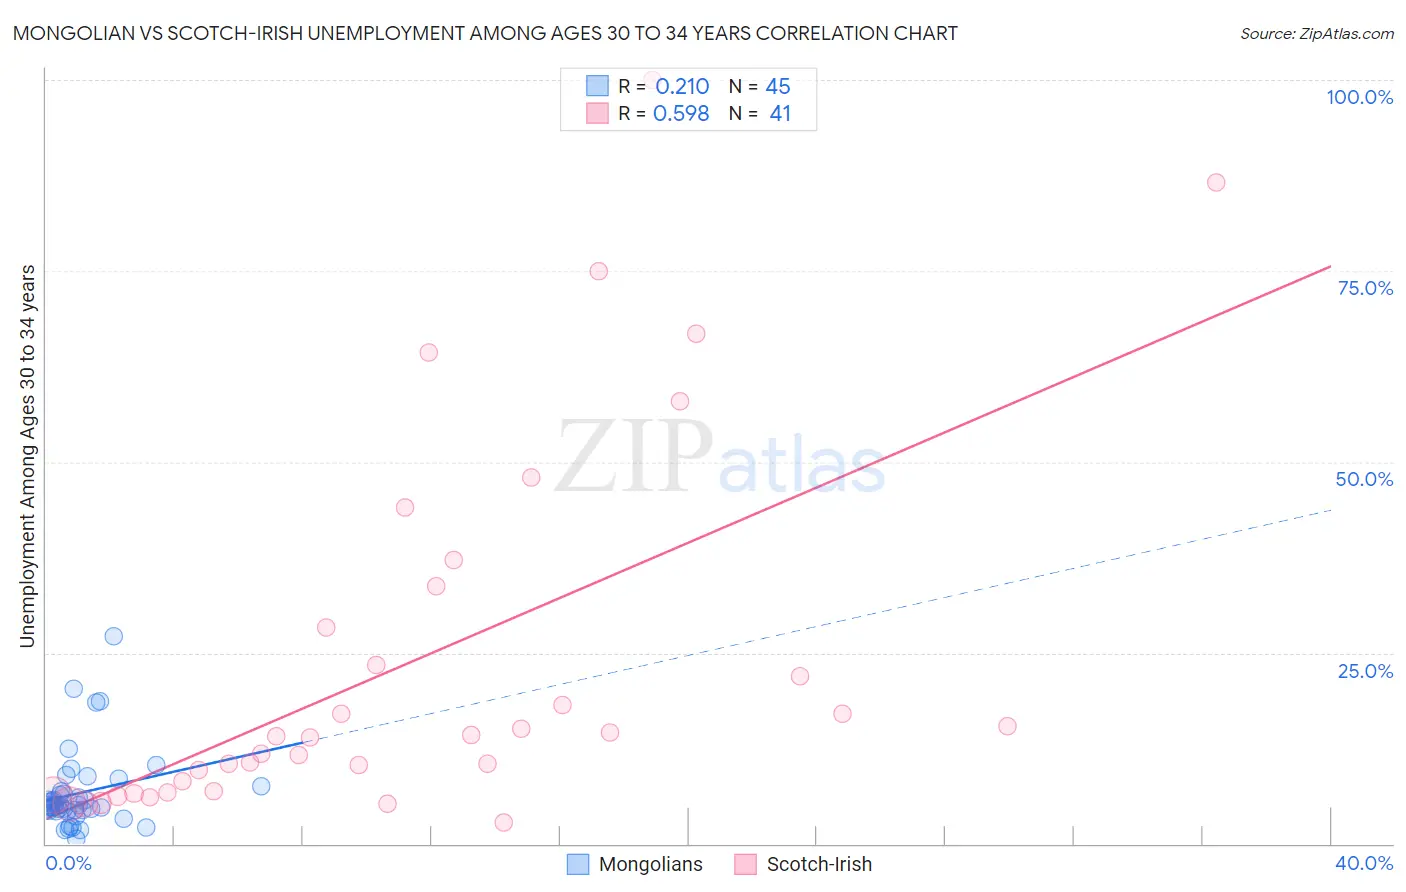
Mongolian vs Scotch-Irish Unemployment Among Ages 30 to 34 years Correlation Chart

The statistical analysis conducted on geographies consisting of 137,790,931 people shows a weak positive correlation between the proportion of Mongolians and unemployment rate among population between the ages 30 and 34 in the United States with a correlation coefficient (R) of 0.210 and weighted average of 5.2%. Similarly, the statistical analysis conducted on geographies consisting of 482,054,046 people shows a substantial positive correlation between the proportion of Scotch-Irish and unemployment rate among population between the ages 30 and 34 in the United States with a correlation coefficient (R) of 0.598 and weighted average of 5.7%, a difference of 8.6%.
Mongolian vs Scotch-Irish Unemployment Among Ages 30 to 34 years

Unemployment Among Ages 30 to 34 years Correlation Summary

MeasurementMongolianScotch-Irish
Minimum0.60%2.8%
Maximum27.1%100.0%
Range26.5%97.2%
Mean6.7%23.7%
Median5.0%14.0%
Interquartile 25% (IQ1)4.3%6.8%
Interquartile 75% (IQ3)7.2%31.1%
Interquartile Range (IQR)2.9%24.3%
Standard Deviation (Sample)5.2%24.5%
Standard Deviation (Population)5.2%24.2%

Similar Demographics by Unemployment Among Ages 30 to 34 years

Demographics Similar to Mongolians by Unemployment Among Ages 30 to 34 years

In terms of unemployment among ages 30 to 34 years, the demographic groups most similar to Mongolians are European (5.2%, a difference of 0.010%), Kenyan (5.2%, a difference of 0.090%), Maltese (5.2%, a difference of 0.16%), Laotian (5.2%, a difference of 0.17%), and Immigrants from North Macedonia (5.2%, a difference of 0.19%).
DemographicsRating | RankUnemployment Among Ages 30 to 34 years
Immigrants | Sweden
93.3
/100
|
#89
Exceptional
5.2%
Immigrants | Romania
92.8
/100
|
#90
Exceptional
5.2%
Iraqis
92.6
/100
|
#91
Exceptional
5.2%
Immigrants | Argentina
92.5
/100
|
#92
Exceptional
5.2%
Laotians
92.4
/100
|
#93
Exceptional
5.2%
Maltese
92.3
/100
|
#94
Exceptional
5.2%
Kenyans
92.1
/100
|
#95
Exceptional
5.2%
Mongolians
91.7
/100
|
#96
Exceptional
5.2%
Europeans
91.7
/100
|
#97
Exceptional
5.2%
Immigrants | North Macedonia
90.9
/100
|
#98
Exceptional
5.2%
Immigrants | Ireland
90.6
/100
|
#99
Exceptional
5.2%
Immigrants | Czechoslovakia
89.5
/100
|
#100
Excellent
5.3%
British
89.1
/100
|
#101
Excellent
5.3%
Immigrants | Switzerland
88.8
/100
|
#102
Excellent
5.3%
Immigrants | Jordan
88.8
/100
|
#103
Excellent
5.3%

Demographics Similar to Scotch-Irish by Unemployment Among Ages 30 to 34 years

In terms of unemployment among ages 30 to 34 years, the demographic groups most similar to Scotch-Irish are Spanish American Indian (5.7%, a difference of 0.010%), White/Caucasian (5.7%, a difference of 0.11%), Immigrants (5.7%, a difference of 0.35%), French (5.7%, a difference of 0.42%), and Immigrants from Philippines (5.7%, a difference of 0.54%).
DemographicsRating | RankUnemployment Among Ages 30 to 34 years
Immigrants | Costa Rica
14.4
/100
|
#205
Poor
5.6%
Alsatians
14.3
/100
|
#206
Poor
5.6%
Israelis
12.8
/100
|
#207
Poor
5.6%
Immigrants | Philippines
11.5
/100
|
#208
Poor
5.7%
French
10.8
/100
|
#209
Poor
5.7%
Whites/Caucasians
9.2
/100
|
#210
Tragic
5.7%
Spanish American Indians
8.7
/100
|
#211
Tragic
5.7%
Scotch-Irish
8.6
/100
|
#212
Tragic
5.7%
Immigrants | Immigrants
7.1
/100
|
#213
Tragic
5.7%
Immigrants | Panama
5.9
/100
|
#214
Tragic
5.7%
Immigrants | Cambodia
5.8
/100
|
#215
Tragic
5.7%
Immigrants | Syria
5.5
/100
|
#216
Tragic
5.7%
Immigrants | Fiji
5.1
/100
|
#217
Tragic
5.7%
Panamanians
4.5
/100
|
#218
Tragic
5.8%
French Canadians
4.4
/100
|
#219
Tragic
5.8%