Mexican American Indian vs Immigrants from South Central Asia Unemployment Among Ages 60 to 64 years
COMPARE
Mexican American Indian
Immigrants from South Central Asia
Unemployment Among Ages 60 to 64 years
Unemployment Among Ages 60 to 64 years Comparison
Mexican American Indians
Immigrants from South Central Asia
5.3%
UNEMPLOYMENT AMONG AGES 60 TO 64 YEARS
0.0/ 100
METRIC RATING
286th/ 347
METRIC RANK
4.7%
UNEMPLOYMENT AMONG AGES 60 TO 64 YEARS
93.0/ 100
METRIC RATING
126th/ 347
METRIC RANK
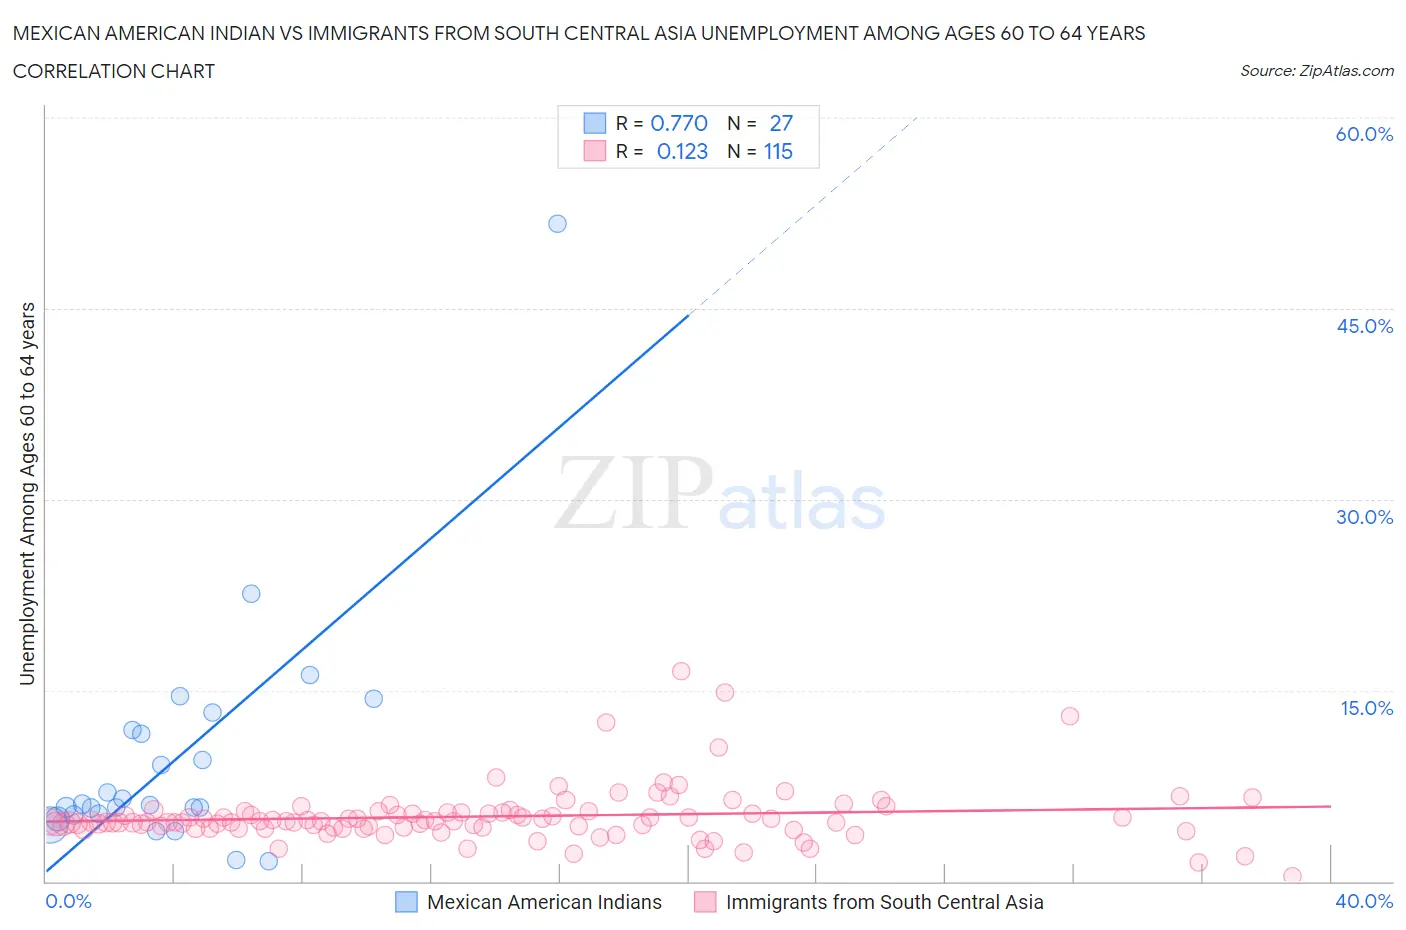
Mexican American Indian vs Immigrants from South Central Asia Unemployment Among Ages 60 to 64 years Correlation Chart
The statistical analysis conducted on geographies consisting of 293,329,819 people shows a strong positive correlation between the proportion of Mexican American Indians and unemployment rate among population between the ages 60 and 64 in the United States with a correlation coefficient (R) of 0.770 and weighted average of 5.3%. Similarly, the statistical analysis conducted on geographies consisting of 418,199,861 people shows a poor positive correlation between the proportion of Immigrants from South Central Asia and unemployment rate among population between the ages 60 and 64 in the United States with a correlation coefficient (R) of 0.123 and weighted average of 4.7%, a difference of 11.2%.
Unemployment Among Ages 60 to 64 years Correlation Summary
| Measurement | Mexican American Indian | Immigrants from South Central Asia |
| Minimum | 1.6% | 0.40% |
| Maximum | 51.7% | 16.5% |
| Range | 50.1% | 16.1% |
| Mean | 9.6% | 5.1% |
| Median | 6.0% | 4.7% |
| Interquartile 25% (IQ1) | 5.2% | 4.2% |
| Interquartile 75% (IQ3) | 11.9% | 5.4% |
| Interquartile Range (IQR) | 6.7% | 1.2% |
| Standard Deviation (Sample) | 9.7% | 2.2% |
| Standard Deviation (Population) | 9.5% | 2.2% |
Similar Demographics by Unemployment Among Ages 60 to 64 years
Demographics Similar to Mexican American Indians by Unemployment Among Ages 60 to 64 years
In terms of unemployment among ages 60 to 64 years, the demographic groups most similar to Mexican American Indians are Salvadoran (5.3%, a difference of 0.040%), West Indian (5.3%, a difference of 0.11%), Trinidadian and Tobagonian (5.3%, a difference of 0.22%), Taiwanese (5.3%, a difference of 0.24%), and Spanish American (5.3%, a difference of 0.25%).
| Demographics | Rating | Rank | Unemployment Among Ages 60 to 64 years |
| Nepalese | 0.0 /100 | #279 | Tragic 5.2% |
| French American Indians | 0.0 /100 | #280 | Tragic 5.2% |
| Immigrants | Haiti | 0.0 /100 | #281 | Tragic 5.2% |
| Mexicans | 0.0 /100 | #282 | Tragic 5.2% |
| Immigrants | Guatemala | 0.0 /100 | #283 | Tragic 5.3% |
| Taiwanese | 0.0 /100 | #284 | Tragic 5.3% |
| West Indians | 0.0 /100 | #285 | Tragic 5.3% |
| Mexican American Indians | 0.0 /100 | #286 | Tragic 5.3% |
| Salvadorans | 0.0 /100 | #287 | Tragic 5.3% |
| Trinidadians and Tobagonians | 0.0 /100 | #288 | Tragic 5.3% |
| Spanish Americans | 0.0 /100 | #289 | Tragic 5.3% |
| Immigrants | Trinidad and Tobago | 0.0 /100 | #290 | Tragic 5.3% |
| Hispanics or Latinos | 0.0 /100 | #291 | Tragic 5.3% |
| Immigrants | Latin America | 0.0 /100 | #292 | Tragic 5.3% |
| Immigrants | Israel | 0.0 /100 | #293 | Tragic 5.3% |
Demographics Similar to Immigrants from South Central Asia by Unemployment Among Ages 60 to 64 years
In terms of unemployment among ages 60 to 64 years, the demographic groups most similar to Immigrants from South Central Asia are Immigrants from Thailand (4.7%, a difference of 0.10%), Austrian (4.8%, a difference of 0.14%), Immigrants from Senegal (4.7%, a difference of 0.24%), Finnish (4.7%, a difference of 0.27%), and Choctaw (4.8%, a difference of 0.32%).
| Demographics | Rating | Rank | Unemployment Among Ages 60 to 64 years |
| Immigrants | Morocco | 95.7 /100 | #119 | Exceptional 4.7% |
| Macedonians | 95.7 /100 | #120 | Exceptional 4.7% |
| Albanians | 95.3 /100 | #121 | Exceptional 4.7% |
| Immigrants | Kazakhstan | 95.1 /100 | #122 | Exceptional 4.7% |
| Finns | 94.7 /100 | #123 | Exceptional 4.7% |
| Immigrants | Senegal | 94.5 /100 | #124 | Exceptional 4.7% |
| Immigrants | Thailand | 93.7 /100 | #125 | Exceptional 4.7% |
| Immigrants | South Central Asia | 93.0 /100 | #126 | Exceptional 4.7% |
| Austrians | 91.9 /100 | #127 | Exceptional 4.8% |
| Choctaw | 90.3 /100 | #128 | Exceptional 4.8% |
| Immigrants | Serbia | 90.2 /100 | #129 | Exceptional 4.8% |
| Immigrants | Syria | 90.1 /100 | #130 | Exceptional 4.8% |
| Immigrants | Lebanon | 89.6 /100 | #131 | Excellent 4.8% |
| Lithuanians | 89.6 /100 | #132 | Excellent 4.8% |
| Yaqui | 89.5 /100 | #133 | Excellent 4.8% |