Maltese vs Immigrants from Eastern Africa Unemployment Among Ages 30 to 34 years

COMPARE

Maltese
Race
Ancestry
AfghanAfricanAlaska NativeAlaskan AthabascanAlbanianAleutAlsatianAmericanApacheArabArapahoArgentineanArmenianAssyrian/Chaldean/SyriacAustralianAustrianBahamianBangladeshiBarbadianBasqueBelgianBelizeanBermudanBhutaneseBlackfeetBolivianBrazilianBritishBritish West IndianBulgarianBurmeseCajunCambodianCanadianCape VerdeanCarpatho RusynCelticCentral AmericanCentral American IndianCherokeeCheyenneChickasawChileanChineseChippewaChoctawColombianColvilleComancheCosta RicanCreeCreekCroatianCrowCubanCypriotCzechCzechoslovakianDanishDelawareDominicanDutchDutch West IndianEastern EuropeanEcuadorianEgyptianEnglishEstonianEthiopianEuropeanFijianFilipinoFinnishFrenchFrench American IndianFrench CanadianGermanGerman RussianGhanaianGreekGuamanian/ChamorroGuatemalanGuyaneseHaitianHmongHonduranHopiHoumaHungarianIcelanderIndian (Asian)IndonesianInupiatIranianIraqiIrishIroquoisIsraeliItalianJamaicanJapaneseJordanianKenyanKiowaKoreanLaotianLatvianLebaneseLiberianLithuanianLumbeeLuxembourgerMacedonianMalaysianMalteseMarshalleseMenomineeMexicanMexican American IndianMongolianMoroccanNative HawaiianNavajoNepaleseNew ZealanderNicaraguanNigerianNorthern EuropeanNorwegianOkinawanOsageOttawaPaiutePakistaniPalestinianPanamanianParaguayanPennsylvania GermanPeruvianPimaPolishPortuguesePotawatomiPuebloPuerto RicanPuget Sound SalishRomanianRussianSalvadoranSamoanScandinavianScotch-IrishScottishSeminoleSenegaleseSerbianShoshoneSierra LeoneanSiouxSlavicSlovakSloveneSomaliSouth AfricanSouth AmericanSouth American IndianSoviet UnionSpaniardSpanishSpanish AmericanSpanish American IndianSri LankanSubsaharan AfricanSudaneseSwedishSwissSyrianTaiwaneseThaiTlingit-HaidaTohono O'OdhamTonganTrinidadian and TobagonianTsimshianTurkishU.S. Virgin IslanderUgandanUkrainianUruguayanUteVenezuelanVietnameseWelshWest IndianYakamaYaquiYugoslavianYumanYup'ikZimbabwean
Immigration
NonimmigrantsImmigrantsAfghanistanAfricaAlbaniaArgentinaArmeniaAsiaAustraliaAustriaBahamasBangladeshBarbadosBelarusBelgiumBelizeBoliviaBosnia and HerzegovinaBrazilBulgariaBurma/MyanmarCabo VerdeCambodiaCameroonCanadaCaribbeanCentral AmericaChileChinaColombiaCongoCosta RicaCroatiaCubaCzechoslovakiaDenmarkDominicaDominican RepublicEastern AsiaEastern EuropeEcuadorEgyptEl SalvadorEnglandEritreaEthiopiaEuropeFijiFranceGermanyGhanaGreeceGrenadaGuatemalaGuyanaHaitiHondurasHong KongHungaryIndiaIndonesiaIranIraqIrelandIsraelItalyJamaicaJapanJordanKazakhstanKenyaKoreaKuwaitLaosLatin AmericaLatviaLebanonLiberiaLithuaniaMalaysiaMexicoMicronesiaMiddle AfricaMoldovaMoroccoNepalNetherlandsNicaraguaNigeriaNorth AmericaNorth MacedoniaNorthern AfricaNorthern EuropeNorwayOceaniaPakistanPanamaPeruPhilippinesPolandPortugalRomaniaRussiaSaudi ArabiaScotlandSenegalSerbiaSierra LeoneSingaporeSomaliaSouth AfricaSouth AmericaSouth Central AsiaSouth Eastern AsiaSouthern EuropeSpainSri LankaSt. Vincent and the GrenadinesSudanSwedenSwitzerlandSyriaTaiwanThailandTrinidad and TobagoTurkeyUgandaUkraineUruguayUzbekistanVenezuelaVietnamWest IndiesWestern AfricaWestern AsiaWestern EuropeYemenZaireZimbabweAzores
Immigrants from Eastern Africa
Race
Ancestry
AfghanAfricanAlaska NativeAlaskan AthabascanAlbanianAleutAlsatianAmericanApacheArabArapahoArgentineanArmenianAssyrian/Chaldean/SyriacAustralianAustrianBahamianBangladeshiBarbadianBasqueBelgianBelizeanBermudanBhutaneseBlackfeetBolivianBrazilianBritishBritish West IndianBulgarianBurmeseCajunCambodianCanadianCape VerdeanCarpatho RusynCelticCentral AmericanCentral American IndianCherokeeCheyenneChickasawChileanChineseChippewaChoctawColombianColvilleComancheCosta RicanCreeCreekCroatianCrowCubanCypriotCzechCzechoslovakianDanishDelawareDominicanDutchDutch West IndianEastern EuropeanEcuadorianEgyptianEnglishEstonianEthiopianEuropeanFijianFilipinoFinnishFrenchFrench American IndianFrench CanadianGermanGerman RussianGhanaianGreekGuamanian/ChamorroGuatemalanGuyaneseHaitianHmongHonduranHopiHoumaHungarianIcelanderIndian (Asian)IndonesianInupiatIranianIraqiIrishIroquoisIsraeliItalianJamaicanJapaneseJordanianKenyanKiowaKoreanLaotianLatvianLebaneseLiberianLithuanianLumbeeLuxembourgerMacedonianMalaysianMarshalleseMenomineeMexicanMexican American IndianMongolianMoroccanNative HawaiianNavajoNepaleseNew ZealanderNicaraguanNigerianNorthern EuropeanNorwegianOkinawanOsageOttawaPaiutePakistaniPalestinianPanamanianParaguayanPennsylvania GermanPeruvianPimaPolishPortuguesePotawatomiPuebloPuerto RicanPuget Sound SalishRomanianRussianSalvadoranSamoanScandinavianScotch-IrishScottishSeminoleSenegaleseSerbianShoshoneSierra LeoneanSiouxSlavicSlovakSloveneSomaliSouth AfricanSouth AmericanSouth American IndianSoviet UnionSpaniardSpanishSpanish AmericanSpanish American IndianSri LankanSubsaharan AfricanSudaneseSwedishSwissSyrianTaiwaneseThaiTlingit-HaidaTohono O'OdhamTonganTrinidadian and TobagonianTsimshianTurkishU.S. Virgin IslanderUgandanUkrainianUruguayanUteVenezuelanVietnameseWelshWest IndianYakamaYaquiYugoslavianYumanYup'ikZimbabwean
Immigration
NonimmigrantsImmigrantsAfghanistanAfricaAlbaniaArgentinaArmeniaAsiaAustraliaAustriaBahamasBangladeshBarbadosBelarusBelgiumBelizeBoliviaBosnia and HerzegovinaBrazilBulgariaBurma/MyanmarCabo VerdeCambodiaCameroonCanadaCaribbeanCentral AmericaChileChinaColombiaCongoCosta RicaCroatiaCubaCzechoslovakiaDenmarkDominicaDominican RepublicEastern AfricaEastern AsiaEastern EuropeEcuadorEgyptEl SalvadorEnglandEritreaEthiopiaEuropeFijiFranceGermanyGhanaGreeceGrenadaGuatemalaGuyanaHaitiHondurasHong KongHungaryIndiaIndonesiaIranIraqIrelandIsraelItalyJamaicaJapanJordanKazakhstanKenyaKoreaKuwaitLaosLatin AmericaLatviaLebanonLiberiaLithuaniaMalaysiaMexicoMicronesiaMiddle AfricaMoldovaMoroccoNepalNetherlandsNicaraguaNigeriaNorth AmericaNorth MacedoniaNorthern AfricaNorthern EuropeNorwayOceaniaPakistanPanamaPeruPhilippinesPolandPortugalRomaniaRussiaSaudi ArabiaScotlandSenegalSerbiaSierra LeoneSingaporeSomaliaSouth AfricaSouth AmericaSouth Central AsiaSouth Eastern AsiaSouthern EuropeSpainSri LankaSt. Vincent and the GrenadinesSudanSwedenSwitzerlandSyriaTaiwanThailandTrinidad and TobagoTurkeyUgandaUkraineUruguayUzbekistanVenezuelaVietnamWest IndiesWestern AfricaWestern AsiaWestern EuropeYemenZaireZimbabweAzores
Unemployment Among Ages 30 to 34 years
Income
Poverty
Unemployment
Labor Participation
Family Structure
Vehicle Availability
Education Level
Disability

Unemployment Among Ages 30 to 34 years Comparison

Maltese

Immigrants from Eastern Africa

Exceptional
Exceptional
5.2%
UNEMPLOYMENT AMONG AGES 30 TO 34 YEARS
92.3/ 100
METRIC RATING
94th/ 347
METRIC RANK
5.0%
UNEMPLOYMENT AMONG AGES 30 TO 34 YEARS
98.9/ 100
METRIC RATING
41st/ 347
METRIC RANK

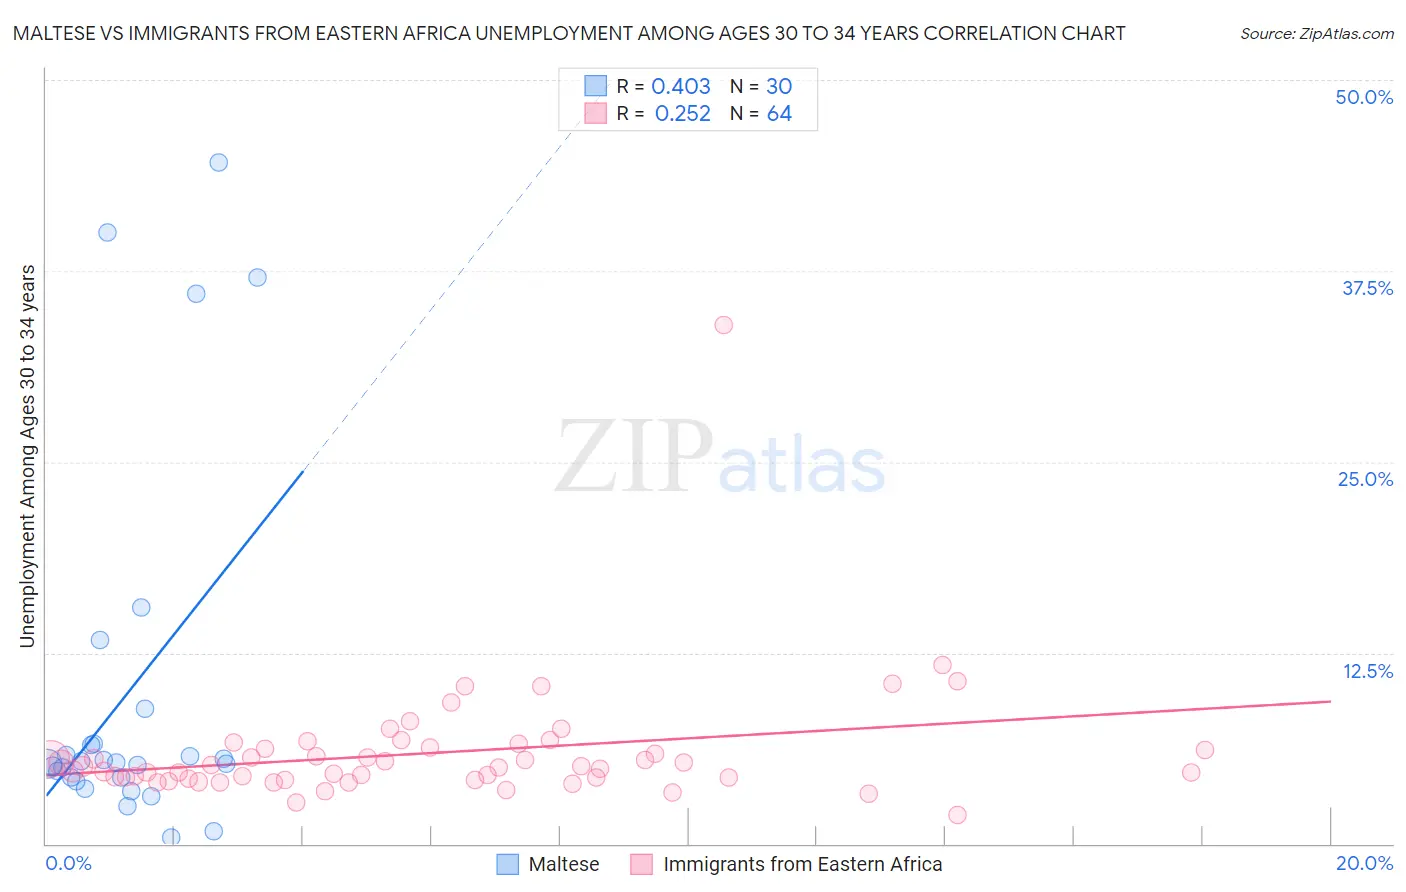
Maltese vs Immigrants from Eastern Africa Unemployment Among Ages 30 to 34 years Correlation Chart

The statistical analysis conducted on geographies consisting of 123,021,177 people shows a moderate positive correlation between the proportion of Maltese and unemployment rate among population between the ages 30 and 34 in the United States with a correlation coefficient (R) of 0.403 and weighted average of 5.2%. Similarly, the statistical analysis conducted on geographies consisting of 339,538,992 people shows a weak positive correlation between the proportion of Immigrants from Eastern Africa and unemployment rate among population between the ages 30 and 34 in the United States with a correlation coefficient (R) of 0.252 and weighted average of 5.0%, a difference of 3.8%.
Maltese vs Immigrants from Eastern Africa Unemployment Among Ages 30 to 34 years

Unemployment Among Ages 30 to 34 years Correlation Summary

MeasurementMalteseImmigrants from Eastern Africa
Minimum0.40%1.9%
Maximum44.6%34.0%
Range44.2%32.1%
Mean10.0%5.9%
Median5.3%5.0%
Interquartile 25% (IQ1)4.3%4.3%
Interquartile 75% (IQ3)6.6%6.2%
Interquartile Range (IQR)2.2%2.0%
Standard Deviation (Sample)12.2%4.1%
Standard Deviation (Population)12.0%4.0%

Similar Demographics by Unemployment Among Ages 30 to 34 years

Demographics Similar to Maltese by Unemployment Among Ages 30 to 34 years

In terms of unemployment among ages 30 to 34 years, the demographic groups most similar to Maltese are Laotian (5.2%, a difference of 0.0%), Immigrants from Argentina (5.2%, a difference of 0.050%), Iraqi (5.2%, a difference of 0.070%), Kenyan (5.2%, a difference of 0.070%), and Immigrants from Romania (5.2%, a difference of 0.12%).
DemographicsRating | RankUnemployment Among Ages 30 to 34 years
Bhutanese
93.5
/100
|
#87
Exceptional
5.2%
Immigrants | Kenya
93.3
/100
|
#88
Exceptional
5.2%
Immigrants | Sweden
93.3
/100
|
#89
Exceptional
5.2%
Immigrants | Romania
92.8
/100
|
#90
Exceptional
5.2%
Iraqis
92.6
/100
|
#91
Exceptional
5.2%
Immigrants | Argentina
92.5
/100
|
#92
Exceptional
5.2%
Laotians
92.4
/100
|
#93
Exceptional
5.2%
Maltese
92.3
/100
|
#94
Exceptional
5.2%
Kenyans
92.1
/100
|
#95
Exceptional
5.2%
Mongolians
91.7
/100
|
#96
Exceptional
5.2%
Europeans
91.7
/100
|
#97
Exceptional
5.2%
Immigrants | North Macedonia
90.9
/100
|
#98
Exceptional
5.2%
Immigrants | Ireland
90.6
/100
|
#99
Exceptional
5.2%
Immigrants | Czechoslovakia
89.5
/100
|
#100
Excellent
5.3%
British
89.1
/100
|
#101
Excellent
5.3%

Demographics Similar to Immigrants from Eastern Africa by Unemployment Among Ages 30 to 34 years

In terms of unemployment among ages 30 to 34 years, the demographic groups most similar to Immigrants from Eastern Africa are Immigrants from Vietnam (5.0%, a difference of 0.0%), Fijian (5.0%, a difference of 0.080%), Immigrants from Hong Kong (5.0%, a difference of 0.18%), Immigrants from Turkey (5.0%, a difference of 0.19%), and Sri Lankan (5.0%, a difference of 0.19%).
DemographicsRating | RankUnemployment Among Ages 30 to 34 years
Latvians
99.3
/100
|
#34
Exceptional
5.0%
Immigrants | Ethiopia
99.2
/100
|
#35
Exceptional
5.0%
Czechs
99.2
/100
|
#36
Exceptional
5.0%
Immigrants | Turkey
99.0
/100
|
#37
Exceptional
5.0%
Sri Lankans
99.0
/100
|
#38
Exceptional
5.0%
Fijians
99.0
/100
|
#39
Exceptional
5.0%
Immigrants | Vietnam
98.9
/100
|
#40
Exceptional
5.0%
Immigrants | Eastern Africa
98.9
/100
|
#41
Exceptional
5.0%
Immigrants | Hong Kong
98.8
/100
|
#42
Exceptional
5.0%
Soviet Union
98.8
/100
|
#43
Exceptional
5.0%
Immigrants | Belgium
98.7
/100
|
#44
Exceptional
5.1%
Yugoslavians
98.6
/100
|
#45
Exceptional
5.1%
Immigrants | Congo
98.4
/100
|
#46
Exceptional
5.1%
Cypriots
98.4
/100
|
#47
Exceptional
5.1%
Assyrians/Chaldeans/Syriacs
98.4
/100
|
#48
Exceptional
5.1%