Maltese vs Immigrants from Belize Unemployment Among Ages 16 to 19 years

COMPARE

Maltese
Race
Ancestry
AfghanAfricanAlaska NativeAlaskan AthabascanAlbanianAleutAlsatianAmericanApacheArabArapahoArgentineanArmenianAssyrian/Chaldean/SyriacAustralianAustrianBahamianBangladeshiBarbadianBasqueBelgianBelizeanBermudanBhutaneseBlackfeetBolivianBrazilianBritishBritish West IndianBulgarianBurmeseCajunCambodianCanadianCape VerdeanCarpatho RusynCelticCentral AmericanCentral American IndianCherokeeCheyenneChickasawChileanChineseChippewaChoctawColombianColvilleComancheCosta RicanCreeCreekCroatianCrowCubanCypriotCzechCzechoslovakianDanishDelawareDominicanDutchDutch West IndianEastern EuropeanEcuadorianEgyptianEnglishEstonianEthiopianEuropeanFijianFilipinoFinnishFrenchFrench American IndianFrench CanadianGermanGerman RussianGhanaianGreekGuamanian/ChamorroGuatemalanGuyaneseHaitianHmongHonduranHopiHoumaHungarianIcelanderIndian (Asian)IndonesianInupiatIranianIraqiIrishIroquoisIsraeliItalianJamaicanJapaneseJordanianKenyanKiowaKoreanLaotianLatvianLebaneseLiberianLithuanianLumbeeLuxembourgerMacedonianMalaysianMalteseMarshalleseMenomineeMexicanMexican American IndianMongolianMoroccanNative HawaiianNavajoNepaleseNew ZealanderNicaraguanNigerianNorthern EuropeanNorwegianOkinawanOsageOttawaPaiutePakistaniPalestinianPanamanianParaguayanPennsylvania GermanPeruvianPimaPolishPortuguesePotawatomiPuebloPuerto RicanPuget Sound SalishRomanianRussianSalvadoranSamoanScandinavianScotch-IrishScottishSeminoleSenegaleseSerbianShoshoneSierra LeoneanSiouxSlavicSlovakSloveneSomaliSouth AfricanSouth AmericanSouth American IndianSoviet UnionSpaniardSpanishSpanish AmericanSpanish American IndianSri LankanSubsaharan AfricanSudaneseSwedishSwissSyrianTaiwaneseThaiTlingit-HaidaTohono O'OdhamTonganTrinidadian and TobagonianTsimshianTurkishU.S. Virgin IslanderUgandanUkrainianUruguayanUteVenezuelanVietnameseWelshWest IndianYakamaYaquiYugoslavianYumanYup'ikZimbabwean
Immigration
NonimmigrantsImmigrantsAfghanistanAfricaAlbaniaArgentinaArmeniaAsiaAustraliaAustriaBahamasBangladeshBarbadosBelarusBelgiumBoliviaBosnia and HerzegovinaBrazilBulgariaBurma/MyanmarCabo VerdeCambodiaCameroonCanadaCaribbeanCentral AmericaChileChinaColombiaCongoCosta RicaCroatiaCubaCzechoslovakiaDenmarkDominicaDominican RepublicEastern AfricaEastern AsiaEastern EuropeEcuadorEgyptEl SalvadorEnglandEritreaEthiopiaEuropeFijiFranceGermanyGhanaGreeceGrenadaGuatemalaGuyanaHaitiHondurasHong KongHungaryIndiaIndonesiaIranIraqIrelandIsraelItalyJamaicaJapanJordanKazakhstanKenyaKoreaKuwaitLaosLatin AmericaLatviaLebanonLiberiaLithuaniaMalaysiaMexicoMicronesiaMiddle AfricaMoldovaMoroccoNepalNetherlandsNicaraguaNigeriaNorth AmericaNorth MacedoniaNorthern AfricaNorthern EuropeNorwayOceaniaPakistanPanamaPeruPhilippinesPolandPortugalRomaniaRussiaSaudi ArabiaScotlandSenegalSerbiaSierra LeoneSingaporeSomaliaSouth AfricaSouth AmericaSouth Central AsiaSouth Eastern AsiaSouthern EuropeSpainSri LankaSt. Vincent and the GrenadinesSudanSwedenSwitzerlandSyriaTaiwanThailandTrinidad and TobagoTurkeyUgandaUkraineUruguayUzbekistanVenezuelaVietnamWest IndiesWestern AfricaWestern AsiaWestern EuropeYemenZaireZimbabweAzores
Immigrants from Belize
Race
Ancestry
AfghanAfricanAlaska NativeAlaskan AthabascanAlbanianAleutAlsatianAmericanApacheArabArapahoArgentineanArmenianAssyrian/Chaldean/SyriacAustralianAustrianBahamianBangladeshiBarbadianBasqueBelgianBelizeanBermudanBhutaneseBlackfeetBolivianBrazilianBritishBritish West IndianBulgarianBurmeseCajunCambodianCanadianCape VerdeanCarpatho RusynCelticCentral AmericanCentral American IndianCherokeeCheyenneChickasawChileanChineseChippewaChoctawColombianColvilleComancheCosta RicanCreeCreekCroatianCrowCubanCypriotCzechCzechoslovakianDanishDelawareDominicanDutchDutch West IndianEastern EuropeanEcuadorianEgyptianEnglishEstonianEthiopianEuropeanFijianFilipinoFinnishFrenchFrench American IndianFrench CanadianGermanGerman RussianGhanaianGreekGuamanian/ChamorroGuatemalanGuyaneseHaitianHmongHonduranHopiHoumaHungarianIcelanderIndian (Asian)IndonesianInupiatIranianIraqiIrishIroquoisIsraeliItalianJamaicanJapaneseJordanianKenyanKiowaKoreanLaotianLatvianLebaneseLiberianLithuanianLumbeeLuxembourgerMacedonianMalaysianMarshalleseMenomineeMexicanMexican American IndianMongolianMoroccanNative HawaiianNavajoNepaleseNew ZealanderNicaraguanNigerianNorthern EuropeanNorwegianOkinawanOsageOttawaPaiutePakistaniPalestinianPanamanianParaguayanPennsylvania GermanPeruvianPimaPolishPortuguesePotawatomiPuebloPuerto RicanPuget Sound SalishRomanianRussianSalvadoranSamoanScandinavianScotch-IrishScottishSeminoleSenegaleseSerbianShoshoneSierra LeoneanSiouxSlavicSlovakSloveneSomaliSouth AfricanSouth AmericanSouth American IndianSoviet UnionSpaniardSpanishSpanish AmericanSpanish American IndianSri LankanSubsaharan AfricanSudaneseSwedishSwissSyrianTaiwaneseThaiTlingit-HaidaTohono O'OdhamTonganTrinidadian and TobagonianTsimshianTurkishU.S. Virgin IslanderUgandanUkrainianUruguayanUteVenezuelanVietnameseWelshWest IndianYakamaYaquiYugoslavianYumanYup'ikZimbabwean
Immigration
NonimmigrantsImmigrantsAfghanistanAfricaAlbaniaArgentinaArmeniaAsiaAustraliaAustriaBahamasBangladeshBarbadosBelarusBelgiumBelizeBoliviaBosnia and HerzegovinaBrazilBulgariaBurma/MyanmarCabo VerdeCambodiaCameroonCanadaCaribbeanCentral AmericaChileChinaColombiaCongoCosta RicaCroatiaCubaCzechoslovakiaDenmarkDominicaDominican RepublicEastern AfricaEastern AsiaEastern EuropeEcuadorEgyptEl SalvadorEnglandEritreaEthiopiaEuropeFijiFranceGermanyGhanaGreeceGrenadaGuatemalaGuyanaHaitiHondurasHong KongHungaryIndiaIndonesiaIranIraqIrelandIsraelItalyJamaicaJapanJordanKazakhstanKenyaKoreaKuwaitLaosLatin AmericaLatviaLebanonLiberiaLithuaniaMalaysiaMexicoMicronesiaMiddle AfricaMoldovaMoroccoNepalNetherlandsNicaraguaNigeriaNorth AmericaNorth MacedoniaNorthern AfricaNorthern EuropeNorwayOceaniaPakistanPanamaPeruPhilippinesPolandPortugalRomaniaRussiaSaudi ArabiaScotlandSenegalSerbiaSierra LeoneSingaporeSomaliaSouth AfricaSouth AmericaSouth Central AsiaSouth Eastern AsiaSouthern EuropeSpainSri LankaSt. Vincent and the GrenadinesSudanSwedenSwitzerlandSyriaTaiwanThailandTrinidad and TobagoTurkeyUgandaUkraineUruguayUzbekistanVenezuelaVietnamWest IndiesWestern AfricaWestern AsiaWestern EuropeYemenZaireZimbabweAzores
Unemployment Among Ages 16 to 19 years
Income
Poverty
Unemployment
Labor Participation
Family Structure
Vehicle Availability
Education Level
Disability

Unemployment Among Ages 16 to 19 years Comparison

Maltese

Immigrants from Belize

Exceptional
Tragic
16.4%
UNEMPLOYMENT AMONG AGES 16 TO 19 YEARS
99.7/ 100
METRIC RATING
48th/ 347
METRIC RANK
22.2%
UNEMPLOYMENT AMONG AGES 16 TO 19 YEARS
0.0/ 100
METRIC RATING
317th/ 347
METRIC RANK

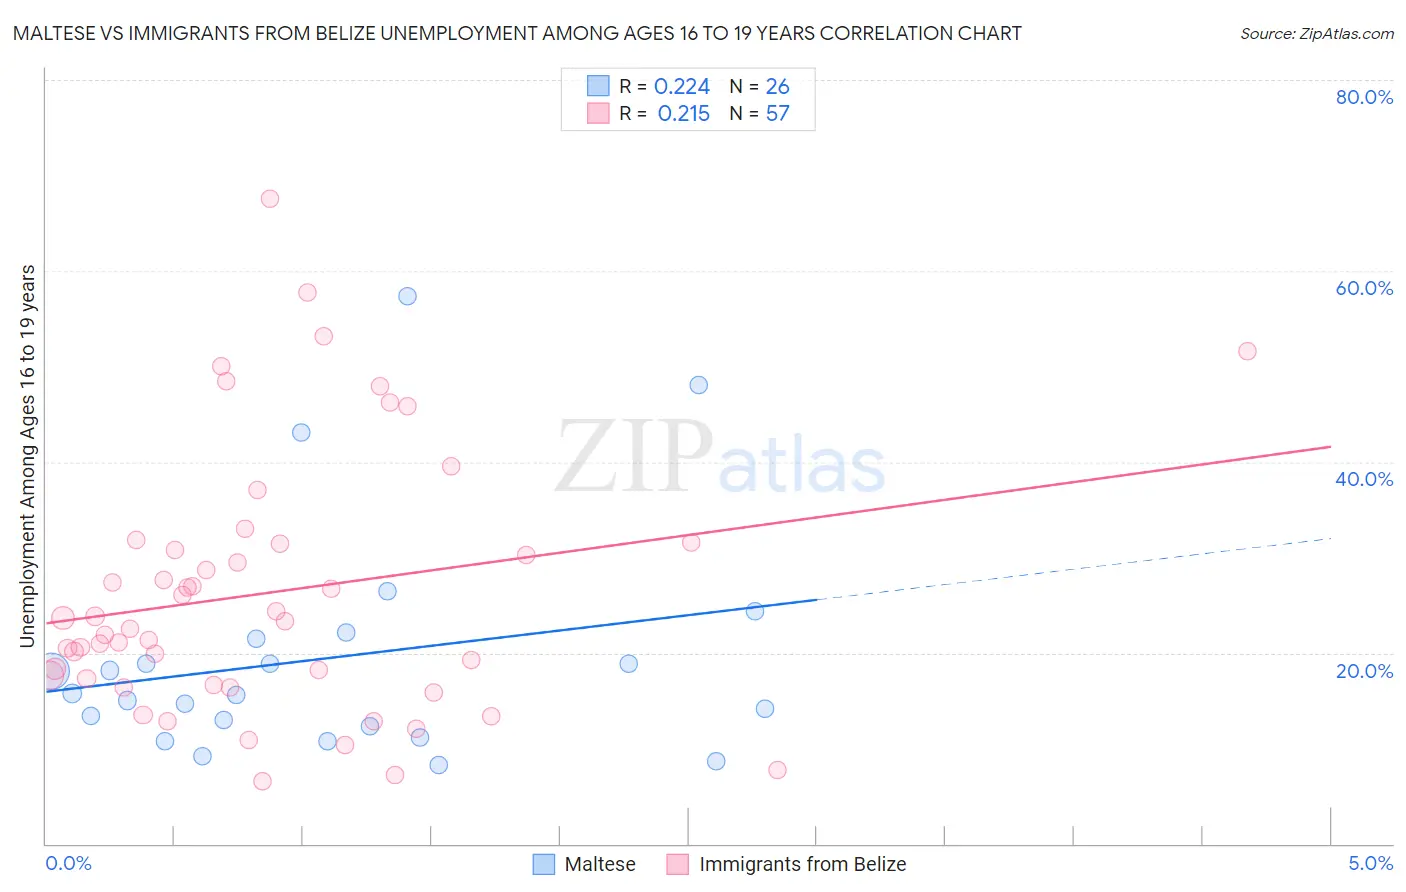
Maltese vs Immigrants from Belize Unemployment Among Ages 16 to 19 years Correlation Chart

The statistical analysis conducted on geographies consisting of 123,062,483 people shows a weak positive correlation between the proportion of Maltese and unemployment rate among population between the ages 16 and 19 in the United States with a correlation coefficient (R) of 0.224 and weighted average of 16.4%. Similarly, the statistical analysis conducted on geographies consisting of 128,436,960 people shows a weak positive correlation between the proportion of Immigrants from Belize and unemployment rate among population between the ages 16 and 19 in the United States with a correlation coefficient (R) of 0.215 and weighted average of 22.2%, a difference of 35.3%.
Maltese vs Immigrants from Belize Unemployment Among Ages 16 to 19 years

Unemployment Among Ages 16 to 19 years Correlation Summary

MeasurementMalteseImmigrants from Belize
Minimum8.3%6.5%
Maximum57.3%67.6%
Range49.0%61.1%
Mean19.5%26.3%
Median15.7%23.3%
Interquartile 25% (IQ1)12.2%17.0%
Interquartile 75% (IQ3)21.4%31.5%
Interquartile Range (IQR)9.2%14.5%
Standard Deviation (Sample)12.2%13.6%
Standard Deviation (Population)11.9%13.5%

Similar Demographics by Unemployment Among Ages 16 to 19 years

Demographics Similar to Maltese by Unemployment Among Ages 16 to 19 years

In terms of unemployment among ages 16 to 19 years, the demographic groups most similar to Maltese are Immigrants from Vietnam (16.4%, a difference of 0.040%), Iraqi (16.4%, a difference of 0.070%), Immigrants from North Macedonia (16.4%, a difference of 0.11%), Polish (16.4%, a difference of 0.14%), and Immigrants from Zimbabwe (16.3%, a difference of 0.15%).
DemographicsRating | RankUnemployment Among Ages 16 to 19 years
Immigrants | Nepal
99.8
/100
|
#41
Exceptional
16.3%
Fijians
99.8
/100
|
#42
Exceptional
16.3%
Immigrants | Lebanon
99.8
/100
|
#43
Exceptional
16.3%
Immigrants | Zimbabwe
99.7
/100
|
#44
Exceptional
16.3%
Poles
99.7
/100
|
#45
Exceptional
16.4%
Immigrants | North Macedonia
99.7
/100
|
#46
Exceptional
16.4%
Immigrants | Vietnam
99.7
/100
|
#47
Exceptional
16.4%
Maltese
99.7
/100
|
#48
Exceptional
16.4%
Iraqis
99.7
/100
|
#49
Exceptional
16.4%
Bhutanese
99.6
/100
|
#50
Exceptional
16.4%
Lebanese
99.6
/100
|
#51
Exceptional
16.4%
Welsh
99.6
/100
|
#52
Exceptional
16.4%
Slovenes
99.6
/100
|
#53
Exceptional
16.4%
British
99.5
/100
|
#54
Exceptional
16.5%
Czechoslovakians
99.5
/100
|
#55
Exceptional
16.5%

Demographics Similar to Immigrants from Belize by Unemployment Among Ages 16 to 19 years

In terms of unemployment among ages 16 to 19 years, the demographic groups most similar to Immigrants from Belize are Immigrants from Jamaica (22.2%, a difference of 0.15%), Immigrants from West Indies (22.2%, a difference of 0.31%), Tohono O'odham (22.1%, a difference of 0.45%), Cheyenne (22.3%, a difference of 0.54%), and Immigrants from Dominica (21.9%, a difference of 0.99%).
DemographicsRating | RankUnemployment Among Ages 16 to 19 years
Vietnamese
0.0
/100
|
#310
Tragic
21.5%
Belizeans
0.0
/100
|
#311
Tragic
21.6%
Houma
0.0
/100
|
#312
Tragic
21.6%
Jamaicans
0.0
/100
|
#313
Tragic
21.7%
Alaska Natives
0.0
/100
|
#314
Tragic
21.8%
Immigrants | Dominica
0.0
/100
|
#315
Tragic
21.9%
Tohono O'odham
0.0
/100
|
#316
Tragic
22.1%
Immigrants | Belize
0.0
/100
|
#317
Tragic
22.2%
Immigrants | Jamaica
0.0
/100
|
#318
Tragic
22.2%
Immigrants | West Indies
0.0
/100
|
#319
Tragic
22.2%
Cheyenne
0.0
/100
|
#320
Tragic
22.3%
West Indians
0.0
/100
|
#321
Tragic
22.4%
Barbadians
0.0
/100
|
#322
Tragic
22.5%
Yakama
0.0
/100
|
#323
Tragic
22.5%
Immigrants | Armenia
0.0
/100
|
#324
Tragic
22.6%