Malaysian vs Lebanese Male Unemployment
COMPARE
Malaysian
Lebanese
Male Unemployment
Male Unemployment Comparison
Malaysians
Lebanese
5.3%
MALE UNEMPLOYMENT
39.6/ 100
METRIC RATING
180th/ 347
METRIC RANK
5.2%
MALE UNEMPLOYMENT
79.9/ 100
METRIC RATING
136th/ 347
METRIC RANK
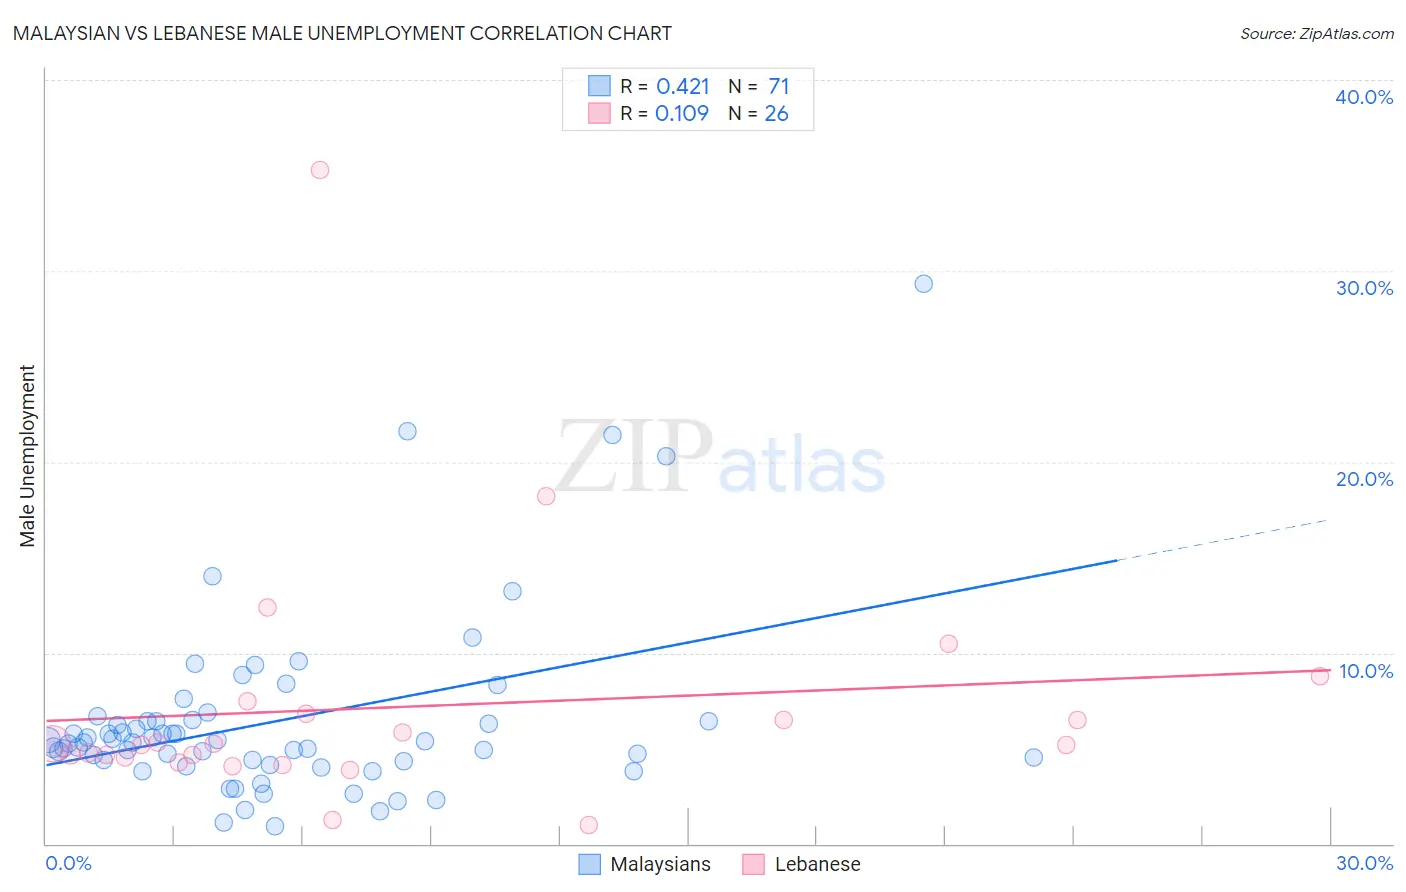
Malaysian vs Lebanese Male Unemployment Correlation Chart
The statistical analysis conducted on geographies consisting of 225,737,190 people shows a moderate positive correlation between the proportion of Malaysians and unemployment rate among males in the United States with a correlation coefficient (R) of 0.421 and weighted average of 5.3%. Similarly, the statistical analysis conducted on geographies consisting of 399,936,199 people shows a poor positive correlation between the proportion of Lebanese and unemployment rate among males in the United States with a correlation coefficient (R) of 0.109 and weighted average of 5.2%, a difference of 2.7%.
Male Unemployment Correlation Summary
| Measurement | Malaysian | Lebanese |
| Minimum | 0.90% | 1.0% |
| Maximum | 29.3% | 35.3% |
| Range | 28.4% | 34.3% |
| Mean | 6.4% | 7.2% |
| Median | 5.3% | 5.2% |
| Interquartile 25% (IQ1) | 4.3% | 4.5% |
| Interquartile 75% (IQ3) | 6.4% | 6.8% |
| Interquartile Range (IQR) | 2.1% | 2.2% |
| Standard Deviation (Sample) | 4.8% | 6.7% |
| Standard Deviation (Population) | 4.8% | 6.6% |
Similar Demographics by Male Unemployment
Demographics Similar to Malaysians by Male Unemployment
In terms of male unemployment, the demographic groups most similar to Malaysians are Immigrants from Oceania (5.3%, a difference of 0.070%), Immigrants from Afghanistan (5.3%, a difference of 0.10%), Potawatomi (5.3%, a difference of 0.11%), Taiwanese (5.3%, a difference of 0.12%), and Osage (5.3%, a difference of 0.17%).
| Demographics | Rating | Rank | Male Unemployment |
| Immigrants | Russia | 50.7 /100 | #173 | Average 5.3% |
| Immigrants | Iran | 50.0 /100 | #174 | Average 5.3% |
| Immigrants | Iraq | 48.1 /100 | #175 | Average 5.3% |
| Immigrants | Poland | 46.0 /100 | #176 | Average 5.3% |
| Immigrants | Peru | 44.6 /100 | #177 | Average 5.3% |
| Osage | 42.5 /100 | #178 | Average 5.3% |
| Immigrants | Oceania | 40.8 /100 | #179 | Average 5.3% |
| Malaysians | 39.6 /100 | #180 | Fair 5.3% |
| Immigrants | Afghanistan | 37.9 /100 | #181 | Fair 5.3% |
| Potawatomi | 37.8 /100 | #182 | Fair 5.3% |
| Taiwanese | 37.6 /100 | #183 | Fair 5.3% |
| Spaniards | 35.1 /100 | #184 | Fair 5.3% |
| Koreans | 34.9 /100 | #185 | Fair 5.3% |
| Iraqis | 31.6 /100 | #186 | Fair 5.4% |
| Costa Ricans | 31.3 /100 | #187 | Fair 5.4% |
Demographics Similar to Lebanese by Male Unemployment
In terms of male unemployment, the demographic groups most similar to Lebanese are Immigrants from Eastern Africa (5.2%, a difference of 0.010%), Immigrants from Saudi Arabia (5.2%, a difference of 0.020%), Immigrants from Croatia (5.2%, a difference of 0.020%), Kenyan (5.2%, a difference of 0.040%), and Pakistani (5.2%, a difference of 0.050%).
| Demographics | Rating | Rank | Male Unemployment |
| Immigrants | Western Europe | 84.8 /100 | #129 | Excellent 5.2% |
| Immigrants | Malaysia | 83.5 /100 | #130 | Excellent 5.2% |
| Immigrants | Germany | 83.0 /100 | #131 | Excellent 5.2% |
| Chickasaw | 82.9 /100 | #132 | Excellent 5.2% |
| Colombians | 81.1 /100 | #133 | Excellent 5.2% |
| Pakistanis | 80.5 /100 | #134 | Excellent 5.2% |
| Immigrants | Saudi Arabia | 80.1 /100 | #135 | Excellent 5.2% |
| Lebanese | 79.9 /100 | #136 | Good 5.2% |
| Immigrants | Eastern Africa | 79.8 /100 | #137 | Good 5.2% |
| Immigrants | Croatia | 79.7 /100 | #138 | Good 5.2% |
| Kenyans | 79.4 /100 | #139 | Good 5.2% |
| Brazilians | 79.3 /100 | #140 | Good 5.2% |
| Immigrants | Switzerland | 79.2 /100 | #141 | Good 5.2% |
| Fijians | 78.3 /100 | #142 | Good 5.2% |
| Syrians | 78.0 /100 | #143 | Good 5.2% |