Macedonian vs Scandinavian Unemployment Among Ages 65 to 74 years

COMPARE

Macedonian
Race
Ancestry
AfghanAfricanAlaska NativeAlaskan AthabascanAlbanianAleutAlsatianAmericanApacheArabArapahoArgentineanArmenianAssyrian/Chaldean/SyriacAustralianAustrianBahamianBangladeshiBarbadianBasqueBelgianBelizeanBermudanBhutaneseBlackfeetBolivianBrazilianBritishBritish West IndianBulgarianBurmeseCajunCambodianCanadianCape VerdeanCarpatho RusynCelticCentral AmericanCentral American IndianCherokeeCheyenneChickasawChileanChineseChippewaChoctawColombianColvilleComancheCosta RicanCreeCreekCroatianCrowCubanCypriotCzechCzechoslovakianDanishDelawareDominicanDutchDutch West IndianEastern EuropeanEcuadorianEgyptianEnglishEstonianEthiopianEuropeanFijianFilipinoFinnishFrenchFrench American IndianFrench CanadianGermanGerman RussianGhanaianGreekGuamanian/ChamorroGuatemalanGuyaneseHaitianHmongHonduranHopiHoumaHungarianIcelanderIndian (Asian)IndonesianInupiatIranianIraqiIrishIroquoisIsraeliItalianJamaicanJapaneseJordanianKenyanKiowaKoreanLaotianLatvianLebaneseLiberianLithuanianLumbeeLuxembourgerMacedonianMalaysianMalteseMarshalleseMenomineeMexicanMexican American IndianMongolianMoroccanNative HawaiianNavajoNepaleseNew ZealanderNicaraguanNigerianNorthern EuropeanNorwegianOkinawanOsageOttawaPaiutePakistaniPalestinianPanamanianParaguayanPennsylvania GermanPeruvianPimaPolishPortuguesePotawatomiPuebloPuerto RicanPuget Sound SalishRomanianRussianSalvadoranSamoanScotch-IrishScottishSeminoleSenegaleseSerbianShoshoneSierra LeoneanSiouxSlavicSlovakSloveneSomaliSouth AfricanSouth AmericanSouth American IndianSoviet UnionSpaniardSpanishSpanish AmericanSpanish American IndianSri LankanSubsaharan AfricanSudaneseSwedishSwissSyrianTaiwaneseThaiTlingit-HaidaTohono O'OdhamTonganTrinidadian and TobagonianTsimshianTurkishU.S. Virgin IslanderUgandanUkrainianUruguayanUteVenezuelanVietnameseWelshWest IndianYakamaYaquiYugoslavianYumanYup'ikZimbabwean
Immigration
NonimmigrantsImmigrantsAfghanistanAfricaAlbaniaArgentinaArmeniaAsiaAustraliaAustriaBahamasBangladeshBarbadosBelarusBelgiumBelizeBoliviaBosnia and HerzegovinaBrazilBulgariaBurma/MyanmarCabo VerdeCambodiaCameroonCanadaCaribbeanCentral AmericaChileChinaColombiaCongoCosta RicaCroatiaCubaCzechoslovakiaDenmarkDominicaDominican RepublicEastern AfricaEastern AsiaEastern EuropeEcuadorEgyptEl SalvadorEnglandEritreaEthiopiaEuropeFijiFranceGermanyGhanaGreeceGrenadaGuatemalaGuyanaHaitiHondurasHong KongHungaryIndiaIndonesiaIranIraqIrelandIsraelItalyJamaicaJapanJordanKazakhstanKenyaKoreaKuwaitLaosLatin AmericaLatviaLebanonLiberiaLithuaniaMalaysiaMexicoMicronesiaMiddle AfricaMoldovaMoroccoNepalNetherlandsNicaraguaNigeriaNorth AmericaNorth MacedoniaNorthern AfricaNorthern EuropeNorwayOceaniaPakistanPanamaPeruPhilippinesPolandPortugalRomaniaRussiaSaudi ArabiaScotlandSenegalSerbiaSierra LeoneSingaporeSomaliaSouth AfricaSouth AmericaSouth Central AsiaSouth Eastern AsiaSouthern EuropeSpainSri LankaSt. Vincent and the GrenadinesSudanSwedenSwitzerlandSyriaTaiwanThailandTrinidad and TobagoTurkeyUgandaUkraineUruguayUzbekistanVenezuelaVietnamWest IndiesWestern AfricaWestern AsiaWestern EuropeYemenZaireZimbabweAzores
Scandinavian
Race
Ancestry
AfghanAfricanAlaska NativeAlaskan AthabascanAlbanianAleutAlsatianAmericanApacheArabArapahoArgentineanArmenianAssyrian/Chaldean/SyriacAustralianAustrianBahamianBangladeshiBarbadianBasqueBelgianBelizeanBermudanBhutaneseBlackfeetBolivianBrazilianBritishBritish West IndianBulgarianBurmeseCajunCambodianCanadianCape VerdeanCarpatho RusynCelticCentral AmericanCentral American IndianCherokeeCheyenneChickasawChileanChineseChippewaChoctawColombianColvilleComancheCosta RicanCreeCreekCroatianCrowCubanCypriotCzechCzechoslovakianDanishDelawareDominicanDutchDutch West IndianEastern EuropeanEcuadorianEgyptianEnglishEstonianEthiopianEuropeanFijianFilipinoFinnishFrenchFrench American IndianFrench CanadianGermanGerman RussianGhanaianGreekGuamanian/ChamorroGuatemalanGuyaneseHaitianHmongHonduranHopiHoumaHungarianIcelanderIndian (Asian)IndonesianInupiatIranianIraqiIrishIroquoisIsraeliItalianJamaicanJapaneseJordanianKenyanKiowaKoreanLaotianLatvianLebaneseLiberianLithuanianLumbeeLuxembourgerMalaysianMalteseMarshalleseMenomineeMexicanMexican American IndianMongolianMoroccanNative HawaiianNavajoNepaleseNew ZealanderNicaraguanNigerianNorthern EuropeanNorwegianOkinawanOsageOttawaPaiutePakistaniPalestinianPanamanianParaguayanPennsylvania GermanPeruvianPimaPolishPortuguesePotawatomiPuebloPuerto RicanPuget Sound SalishRomanianRussianSalvadoranSamoanScandinavianScotch-IrishScottishSeminoleSenegaleseSerbianShoshoneSierra LeoneanSiouxSlavicSlovakSloveneSomaliSouth AfricanSouth AmericanSouth American IndianSoviet UnionSpaniardSpanishSpanish AmericanSpanish American IndianSri LankanSubsaharan AfricanSudaneseSwedishSwissSyrianTaiwaneseThaiTlingit-HaidaTohono O'OdhamTonganTrinidadian and TobagonianTsimshianTurkishU.S. Virgin IslanderUgandanUkrainianUruguayanUteVenezuelanVietnameseWelshWest IndianYakamaYaquiYugoslavianYumanYup'ikZimbabwean
Immigration
NonimmigrantsImmigrantsAfghanistanAfricaAlbaniaArgentinaArmeniaAsiaAustraliaAustriaBahamasBangladeshBarbadosBelarusBelgiumBelizeBoliviaBosnia and HerzegovinaBrazilBulgariaBurma/MyanmarCabo VerdeCambodiaCameroonCanadaCaribbeanCentral AmericaChileChinaColombiaCongoCosta RicaCroatiaCubaCzechoslovakiaDenmarkDominicaDominican RepublicEastern AfricaEastern AsiaEastern EuropeEcuadorEgyptEl SalvadorEnglandEritreaEthiopiaEuropeFijiFranceGermanyGhanaGreeceGrenadaGuatemalaGuyanaHaitiHondurasHong KongHungaryIndiaIndonesiaIranIraqIrelandIsraelItalyJamaicaJapanJordanKazakhstanKenyaKoreaKuwaitLaosLatin AmericaLatviaLebanonLiberiaLithuaniaMalaysiaMexicoMicronesiaMiddle AfricaMoldovaMoroccoNepalNetherlandsNicaraguaNigeriaNorth AmericaNorth MacedoniaNorthern AfricaNorthern EuropeNorwayOceaniaPakistanPanamaPeruPhilippinesPolandPortugalRomaniaRussiaSaudi ArabiaScotlandSenegalSerbiaSierra LeoneSingaporeSomaliaSouth AfricaSouth AmericaSouth Central AsiaSouth Eastern AsiaSouthern EuropeSpainSri LankaSt. Vincent and the GrenadinesSudanSwedenSwitzerlandSyriaTaiwanThailandTrinidad and TobagoTurkeyUgandaUkraineUruguayUzbekistanVenezuelaVietnamWest IndiesWestern AfricaWestern AsiaWestern EuropeYemenZaireZimbabweAzores
Unemployment Among Ages 65 to 74 years
Income
Poverty
Unemployment
Labor Participation
Family Structure
Vehicle Availability
Education Level
Disability

Unemployment Among Ages 65 to 74 years Comparison

Macedonians

Scandinavians

Exceptional
Exceptional
5.0%
UNEMPLOYMENT AMONG AGES 65 TO 74 YEARS
100.0/ 100
METRIC RATING
25th/ 347
METRIC RANK
5.2%
UNEMPLOYMENT AMONG AGES 65 TO 74 YEARS
99.1/ 100
METRIC RATING
69th/ 347
METRIC RANK

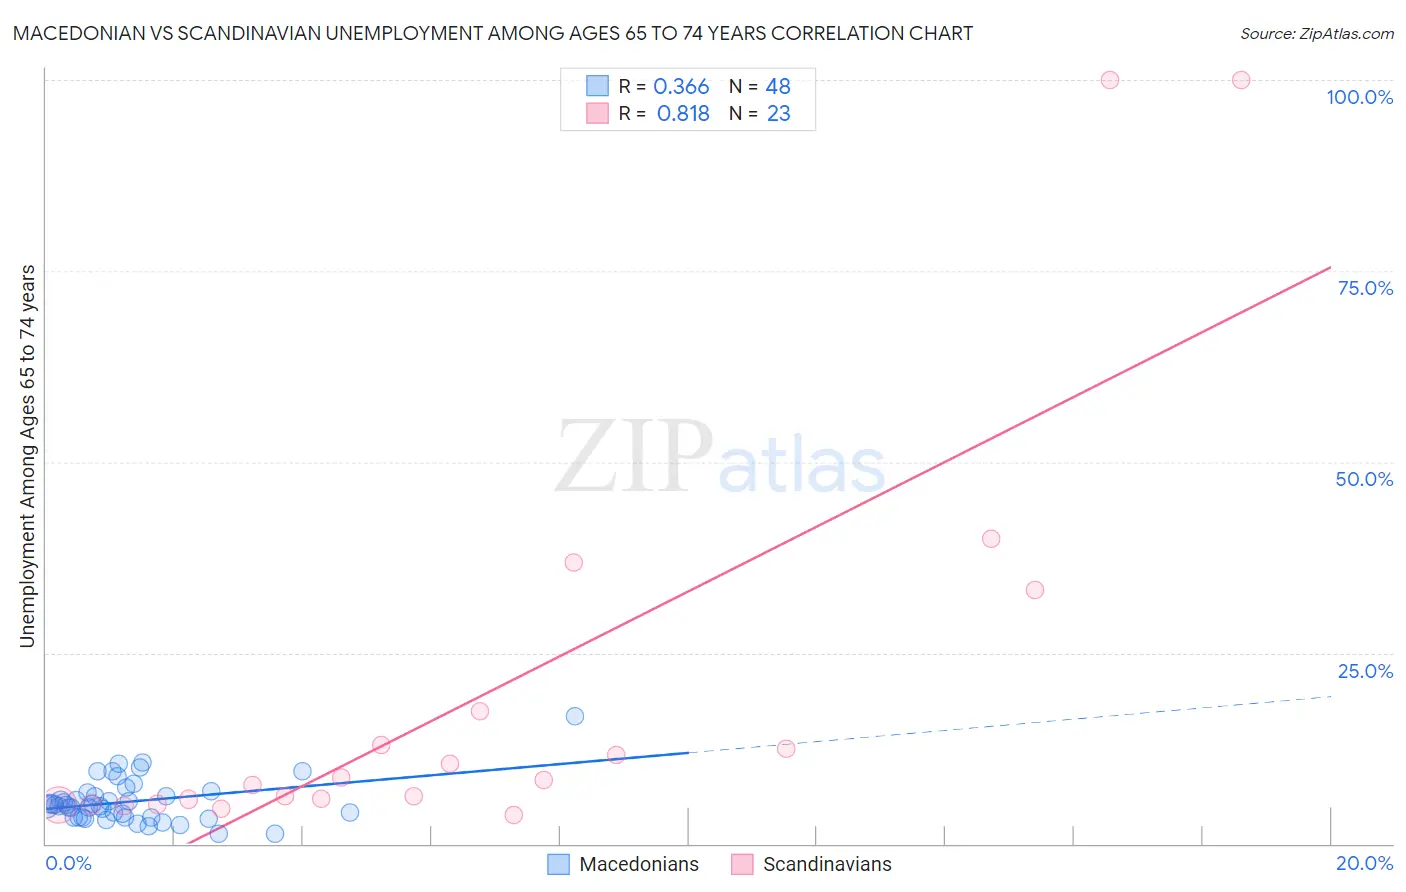
Macedonian vs Scandinavian Unemployment Among Ages 65 to 74 years Correlation Chart

The statistical analysis conducted on geographies consisting of 123,972,473 people shows a mild positive correlation between the proportion of Macedonians and unemployment rate among population between the ages 65 and 74 in the United States with a correlation coefficient (R) of 0.366 and weighted average of 5.0%. Similarly, the statistical analysis conducted on geographies consisting of 389,647,988 people shows a very strong positive correlation between the proportion of Scandinavians and unemployment rate among population between the ages 65 and 74 in the United States with a correlation coefficient (R) of 0.818 and weighted average of 5.2%, a difference of 4.1%.
Macedonian vs Scandinavian Unemployment Among Ages 65 to 74 years

Unemployment Among Ages 65 to 74 years Correlation Summary

MeasurementMacedonianScandinavian
Minimum1.3%3.8%
Maximum16.7%100.0%
Range15.4%96.2%
Mean5.5%19.7%
Median5.0%8.4%
Interquartile 25% (IQ1)3.4%5.2%
Interquartile 75% (IQ3)6.5%17.3%
Interquartile Range (IQR)3.0%12.2%
Standard Deviation (Sample)2.9%27.4%
Standard Deviation (Population)2.8%26.8%

Similar Demographics by Unemployment Among Ages 65 to 74 years

Demographics Similar to Macedonians by Unemployment Among Ages 65 to 74 years

In terms of unemployment among ages 65 to 74 years, the demographic groups most similar to Macedonians are Czech (5.0%, a difference of 0.050%), Norwegian (5.0%, a difference of 0.24%), Bulgarian (5.0%, a difference of 0.34%), Iraqi (4.9%, a difference of 0.56%), and Immigrants from Nepal (4.9%, a difference of 0.77%).
DemographicsRating | RankUnemployment Among Ages 65 to 74 years
Creek
100.0
/100
|
#18
Exceptional
4.8%
Menominee
100.0
/100
|
#19
Exceptional
4.8%
Immigrants | Zaire
100.0
/100
|
#20
Exceptional
4.8%
Immigrants | Eritrea
100.0
/100
|
#21
Exceptional
4.9%
Lebanese
100.0
/100
|
#22
Exceptional
4.9%
Immigrants | Nepal
100.0
/100
|
#23
Exceptional
4.9%
Iraqis
100.0
/100
|
#24
Exceptional
4.9%
Macedonians
100.0
/100
|
#25
Exceptional
5.0%
Czechs
100.0
/100
|
#26
Exceptional
5.0%
Norwegians
100.0
/100
|
#27
Exceptional
5.0%
Bulgarians
100.0
/100
|
#28
Exceptional
5.0%
Ethiopians
100.0
/100
|
#29
Exceptional
5.0%
Immigrants | Lebanon
100.0
/100
|
#30
Exceptional
5.0%
Slovenes
100.0
/100
|
#31
Exceptional
5.0%
Palestinians
100.0
/100
|
#32
Exceptional
5.0%

Demographics Similar to Scandinavians by Unemployment Among Ages 65 to 74 years

In terms of unemployment among ages 65 to 74 years, the demographic groups most similar to Scandinavians are Immigrants from Japan (5.2%, a difference of 0.010%), Swiss (5.1%, a difference of 0.070%), Latvian (5.1%, a difference of 0.070%), Iroquois (5.1%, a difference of 0.12%), and Scotch-Irish (5.2%, a difference of 0.13%).
DemographicsRating | RankUnemployment Among Ages 65 to 74 years
Nicaraguans
99.4
/100
|
#62
Exceptional
5.1%
Kiowa
99.3
/100
|
#63
Exceptional
5.1%
Immigrants | Moldova
99.3
/100
|
#64
Exceptional
5.1%
Bolivians
99.3
/100
|
#65
Exceptional
5.1%
Iroquois
99.3
/100
|
#66
Exceptional
5.1%
Swiss
99.2
/100
|
#67
Exceptional
5.1%
Latvians
99.2
/100
|
#68
Exceptional
5.1%
Scandinavians
99.1
/100
|
#69
Exceptional
5.2%
Immigrants | Japan
99.1
/100
|
#70
Exceptional
5.2%
Scotch-Irish
99.0
/100
|
#71
Exceptional
5.2%
Immigrants | Oceania
99.0
/100
|
#72
Exceptional
5.2%
Filipinos
99.0
/100
|
#73
Exceptional
5.2%
Afghans
99.0
/100
|
#74
Exceptional
5.2%
Okinawans
99.0
/100
|
#75
Exceptional
5.2%
Estonians
99.0
/100
|
#76
Exceptional
5.2%