Luxembourger vs Ute Unemployment Among Ages 55 to 59 years

COMPARE

Luxembourger
Race
Ancestry
AfghanAfricanAlaska NativeAlaskan AthabascanAlbanianAleutAlsatianAmericanApacheArabArapahoArgentineanArmenianAssyrian/Chaldean/SyriacAustralianAustrianBahamianBangladeshiBarbadianBasqueBelgianBelizeanBermudanBhutaneseBlackfeetBolivianBrazilianBritishBritish West IndianBulgarianBurmeseCajunCambodianCanadianCape VerdeanCarpatho RusynCelticCentral AmericanCentral American IndianCherokeeCheyenneChickasawChileanChineseChippewaChoctawColombianColvilleComancheCosta RicanCreeCreekCroatianCrowCubanCypriotCzechCzechoslovakianDanishDelawareDominicanDutchDutch West IndianEastern EuropeanEcuadorianEgyptianEnglishEstonianEthiopianEuropeanFijianFilipinoFinnishFrenchFrench American IndianFrench CanadianGermanGerman RussianGhanaianGreekGuamanian/ChamorroGuatemalanGuyaneseHaitianHmongHonduranHopiHoumaHungarianIcelanderIndian (Asian)IndonesianInupiatIranianIraqiIrishIroquoisIsraeliItalianJamaicanJapaneseJordanianKenyanKiowaKoreanLaotianLatvianLebaneseLiberianLithuanianLumbeeLuxembourgerMacedonianMalaysianMalteseMarshalleseMenomineeMexicanMexican American IndianMongolianMoroccanNative HawaiianNavajoNepaleseNew ZealanderNicaraguanNigerianNorthern EuropeanNorwegianOkinawanOsageOttawaPaiutePakistaniPalestinianPanamanianParaguayanPennsylvania GermanPeruvianPimaPolishPortuguesePotawatomiPuebloPuerto RicanPuget Sound SalishRomanianRussianSalvadoranSamoanScandinavianScotch-IrishScottishSeminoleSenegaleseSerbianShoshoneSierra LeoneanSiouxSlavicSlovakSloveneSomaliSouth AfricanSouth AmericanSouth American IndianSoviet UnionSpaniardSpanishSpanish AmericanSpanish American IndianSri LankanSubsaharan AfricanSudaneseSwedishSwissSyrianTaiwaneseThaiTlingit-HaidaTohono O'OdhamTonganTrinidadian and TobagonianTsimshianTurkishU.S. Virgin IslanderUgandanUkrainianUruguayanVenezuelanVietnameseWelshWest IndianYakamaYaquiYugoslavianYumanYup'ikZimbabwean
Immigration
NonimmigrantsImmigrantsAfghanistanAfricaAlbaniaArgentinaArmeniaAsiaAustraliaAustriaBahamasBangladeshBarbadosBelarusBelgiumBelizeBoliviaBosnia and HerzegovinaBrazilBulgariaBurma/MyanmarCabo VerdeCambodiaCameroonCanadaCaribbeanCentral AmericaChileChinaColombiaCongoCosta RicaCroatiaCubaCzechoslovakiaDenmarkDominicaDominican RepublicEastern AfricaEastern AsiaEastern EuropeEcuadorEgyptEl SalvadorEnglandEritreaEthiopiaEuropeFijiFranceGermanyGhanaGreeceGrenadaGuatemalaGuyanaHaitiHondurasHong KongHungaryIndiaIndonesiaIranIraqIrelandIsraelItalyJamaicaJapanJordanKazakhstanKenyaKoreaKuwaitLaosLatin AmericaLatviaLebanonLiberiaLithuaniaMalaysiaMexicoMicronesiaMiddle AfricaMoldovaMoroccoNepalNetherlandsNicaraguaNigeriaNorth AmericaNorth MacedoniaNorthern AfricaNorthern EuropeNorwayOceaniaPakistanPanamaPeruPhilippinesPolandPortugalRomaniaRussiaSaudi ArabiaScotlandSenegalSerbiaSierra LeoneSingaporeSomaliaSouth AfricaSouth AmericaSouth Central AsiaSouth Eastern AsiaSouthern EuropeSpainSri LankaSt. Vincent and the GrenadinesSudanSwedenSwitzerlandSyriaTaiwanThailandTrinidad and TobagoTurkeyUgandaUkraineUruguayUzbekistanVenezuelaVietnamWest IndiesWestern AfricaWestern AsiaWestern EuropeYemenZaireZimbabweAzores
Ute
Race
Ancestry
AfghanAfricanAlaska NativeAlaskan AthabascanAlbanianAleutAlsatianAmericanApacheArabArapahoArgentineanArmenianAssyrian/Chaldean/SyriacAustralianAustrianBahamianBangladeshiBarbadianBasqueBelgianBelizeanBermudanBhutaneseBlackfeetBolivianBrazilianBritishBritish West IndianBulgarianBurmeseCajunCambodianCanadianCape VerdeanCarpatho RusynCelticCentral AmericanCentral American IndianCherokeeCheyenneChickasawChileanChineseChippewaChoctawColombianColvilleComancheCosta RicanCreeCreekCroatianCrowCubanCypriotCzechCzechoslovakianDanishDelawareDominicanDutchDutch West IndianEastern EuropeanEcuadorianEgyptianEnglishEstonianEthiopianEuropeanFijianFilipinoFinnishFrenchFrench American IndianFrench CanadianGermanGerman RussianGhanaianGreekGuamanian/ChamorroGuatemalanGuyaneseHaitianHmongHonduranHopiHoumaHungarianIcelanderIndian (Asian)IndonesianInupiatIranianIraqiIrishIroquoisIsraeliItalianJamaicanJapaneseJordanianKenyanKiowaKoreanLaotianLatvianLebaneseLiberianLithuanianLumbeeMacedonianMalaysianMalteseMarshalleseMenomineeMexicanMexican American IndianMongolianMoroccanNative HawaiianNavajoNepaleseNew ZealanderNicaraguanNigerianNorthern EuropeanNorwegianOkinawanOsageOttawaPaiutePakistaniPalestinianPanamanianParaguayanPennsylvania GermanPeruvianPimaPolishPortuguesePotawatomiPuebloPuerto RicanPuget Sound SalishRomanianRussianSalvadoranSamoanScandinavianScotch-IrishScottishSeminoleSenegaleseSerbianShoshoneSierra LeoneanSiouxSlavicSlovakSloveneSomaliSouth AfricanSouth AmericanSouth American IndianSoviet UnionSpaniardSpanishSpanish AmericanSpanish American IndianSri LankanSubsaharan AfricanSudaneseSwedishSwissSyrianTaiwaneseThaiTlingit-HaidaTohono O'OdhamTonganTrinidadian and TobagonianTsimshianTurkishU.S. Virgin IslanderUgandanUkrainianUruguayanUteVenezuelanVietnameseWelshWest IndianYakamaYaquiYugoslavianYumanYup'ikZimbabwean
Immigration
NonimmigrantsImmigrantsAfghanistanAfricaAlbaniaArgentinaArmeniaAsiaAustraliaAustriaBahamasBangladeshBarbadosBelarusBelgiumBelizeBoliviaBosnia and HerzegovinaBrazilBulgariaBurma/MyanmarCabo VerdeCambodiaCameroonCanadaCaribbeanCentral AmericaChileChinaColombiaCongoCosta RicaCroatiaCubaCzechoslovakiaDenmarkDominicaDominican RepublicEastern AfricaEastern AsiaEastern EuropeEcuadorEgyptEl SalvadorEnglandEritreaEthiopiaEuropeFijiFranceGermanyGhanaGreeceGrenadaGuatemalaGuyanaHaitiHondurasHong KongHungaryIndiaIndonesiaIranIraqIrelandIsraelItalyJamaicaJapanJordanKazakhstanKenyaKoreaKuwaitLaosLatin AmericaLatviaLebanonLiberiaLithuaniaMalaysiaMexicoMicronesiaMiddle AfricaMoldovaMoroccoNepalNetherlandsNicaraguaNigeriaNorth AmericaNorth MacedoniaNorthern AfricaNorthern EuropeNorwayOceaniaPakistanPanamaPeruPhilippinesPolandPortugalRomaniaRussiaSaudi ArabiaScotlandSenegalSerbiaSierra LeoneSingaporeSomaliaSouth AfricaSouth AmericaSouth Central AsiaSouth Eastern AsiaSouthern EuropeSpainSri LankaSt. Vincent and the GrenadinesSudanSwedenSwitzerlandSyriaTaiwanThailandTrinidad and TobagoTurkeyUgandaUkraineUruguayUzbekistanVenezuelaVietnamWest IndiesWestern AfricaWestern AsiaWestern EuropeYemenZaireZimbabweAzores
Unemployment Among Ages 55 to 59 years
Income
Poverty
Unemployment
Labor Participation
Family Structure
Vehicle Availability
Education Level
Disability

Unemployment Among Ages 55 to 59 years Comparison

Luxembourgers

Ute

Exceptional
Tragic
4.5%
UNEMPLOYMENT AMONG AGES 55 TO 59 YEARS
99.8/ 100
METRIC RATING
41st/ 347
METRIC RANK
5.2%
UNEMPLOYMENT AMONG AGES 55 TO 59 YEARS
0.1/ 100
METRIC RATING
270th/ 347
METRIC RANK

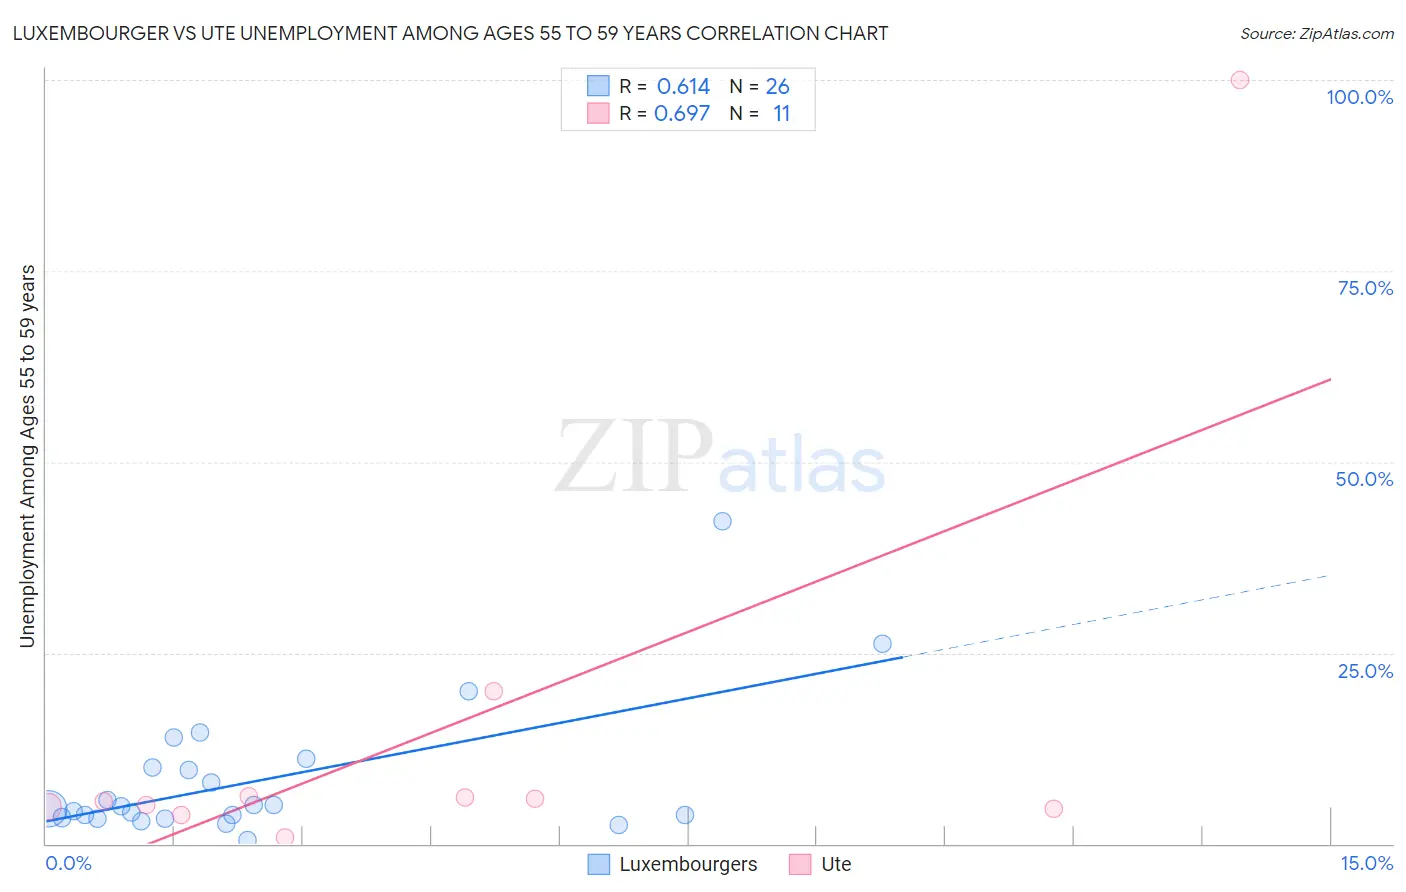
Luxembourger vs Ute Unemployment Among Ages 55 to 59 years Correlation Chart

The statistical analysis conducted on geographies consisting of 138,073,455 people shows a significant positive correlation between the proportion of Luxembourgers and unemployment rate among population between the ages 55 and 59 in the United States with a correlation coefficient (R) of 0.614 and weighted average of 4.5%. Similarly, the statistical analysis conducted on geographies consisting of 54,614,503 people shows a significant positive correlation between the proportion of Ute and unemployment rate among population between the ages 55 and 59 in the United States with a correlation coefficient (R) of 0.697 and weighted average of 5.2%, a difference of 14.7%.
Luxembourger vs Ute Unemployment Among Ages 55 to 59 years

Unemployment Among Ages 55 to 59 years Correlation Summary

MeasurementLuxembourgerUte
Minimum0.50%0.80%
Maximum42.3%100.0%
Range41.8%99.2%
Mean8.4%14.8%
Median4.7%5.6%
Interquartile 25% (IQ1)3.5%4.6%
Interquartile 75% (IQ3)10.0%6.2%
Interquartile Range (IQR)6.5%1.6%
Standard Deviation (Sample)9.1%28.7%
Standard Deviation (Population)8.9%27.3%

Similar Demographics by Unemployment Among Ages 55 to 59 years

Demographics Similar to Luxembourgers by Unemployment Among Ages 55 to 59 years

In terms of unemployment among ages 55 to 59 years, the demographic groups most similar to Luxembourgers are Swiss (4.5%, a difference of 0.010%), Immigrants from Kuwait (4.5%, a difference of 0.030%), Immigrants from Korea (4.5%, a difference of 0.060%), European (4.5%, a difference of 0.070%), and British (4.5%, a difference of 0.13%).
DemographicsRating | RankUnemployment Among Ages 55 to 59 years
Thais
99.9
/100
|
#34
Exceptional
4.5%
Cypriots
99.9
/100
|
#35
Exceptional
4.5%
Ethiopians
99.9
/100
|
#36
Exceptional
4.5%
Immigrants | Bulgaria
99.9
/100
|
#37
Exceptional
4.5%
Assyrians/Chaldeans/Syriacs
99.9
/100
|
#38
Exceptional
4.5%
English
99.9
/100
|
#39
Exceptional
4.5%
Swiss
99.8
/100
|
#40
Exceptional
4.5%
Luxembourgers
99.8
/100
|
#41
Exceptional
4.5%
Immigrants | Kuwait
99.8
/100
|
#42
Exceptional
4.5%
Immigrants | Korea
99.8
/100
|
#43
Exceptional
4.5%
Europeans
99.8
/100
|
#44
Exceptional
4.5%
British
99.8
/100
|
#45
Exceptional
4.5%
Immigrants | Zaire
99.8
/100
|
#46
Exceptional
4.5%
German Russians
99.8
/100
|
#47
Exceptional
4.5%
Immigrants | Moldova
99.7
/100
|
#48
Exceptional
4.5%

Demographics Similar to Ute by Unemployment Among Ages 55 to 59 years

In terms of unemployment among ages 55 to 59 years, the demographic groups most similar to Ute are Tsimshian (5.2%, a difference of 0.17%), Mexican (5.2%, a difference of 0.19%), Immigrants from Senegal (5.2%, a difference of 0.20%), Jamaican (5.2%, a difference of 0.21%), and Yaqui (5.2%, a difference of 0.24%).
DemographicsRating | RankUnemployment Among Ages 55 to 59 years
Immigrants | Sierra Leone
0.1
/100
|
#263
Tragic
5.2%
Immigrants | Caribbean
0.1
/100
|
#264
Tragic
5.2%
Yaqui
0.1
/100
|
#265
Tragic
5.2%
Jamaicans
0.1
/100
|
#266
Tragic
5.2%
Immigrants | Senegal
0.1
/100
|
#267
Tragic
5.2%
Mexicans
0.1
/100
|
#268
Tragic
5.2%
Tsimshian
0.1
/100
|
#269
Tragic
5.2%
Ute
0.1
/100
|
#270
Tragic
5.2%
Cree
0.1
/100
|
#271
Tragic
5.2%
Immigrants | Jamaica
0.0
/100
|
#272
Tragic
5.2%
Ottawa
0.0
/100
|
#273
Tragic
5.2%
Mexican American Indians
0.0
/100
|
#274
Tragic
5.2%
Israelis
0.0
/100
|
#275
Tragic
5.2%
West Indians
0.0
/100
|
#276
Tragic
5.2%
Immigrants | Latin America
0.0
/100
|
#277
Tragic
5.2%