Luxembourger vs Greek Unemployment Among Ages 65 to 74 years
COMPARE
Luxembourger
Greek
Unemployment Among Ages 65 to 74 years
Unemployment Among Ages 65 to 74 years Comparison
Luxembourgers
Greeks
5.2%
UNEMPLOYMENT AMONG AGES 65 TO 74 YEARS
97.6/ 100
METRIC RATING
90th/ 347
METRIC RANK
5.4%
UNEMPLOYMENT AMONG AGES 65 TO 74 YEARS
51.1/ 100
METRIC RATING
172nd/ 347
METRIC RANK
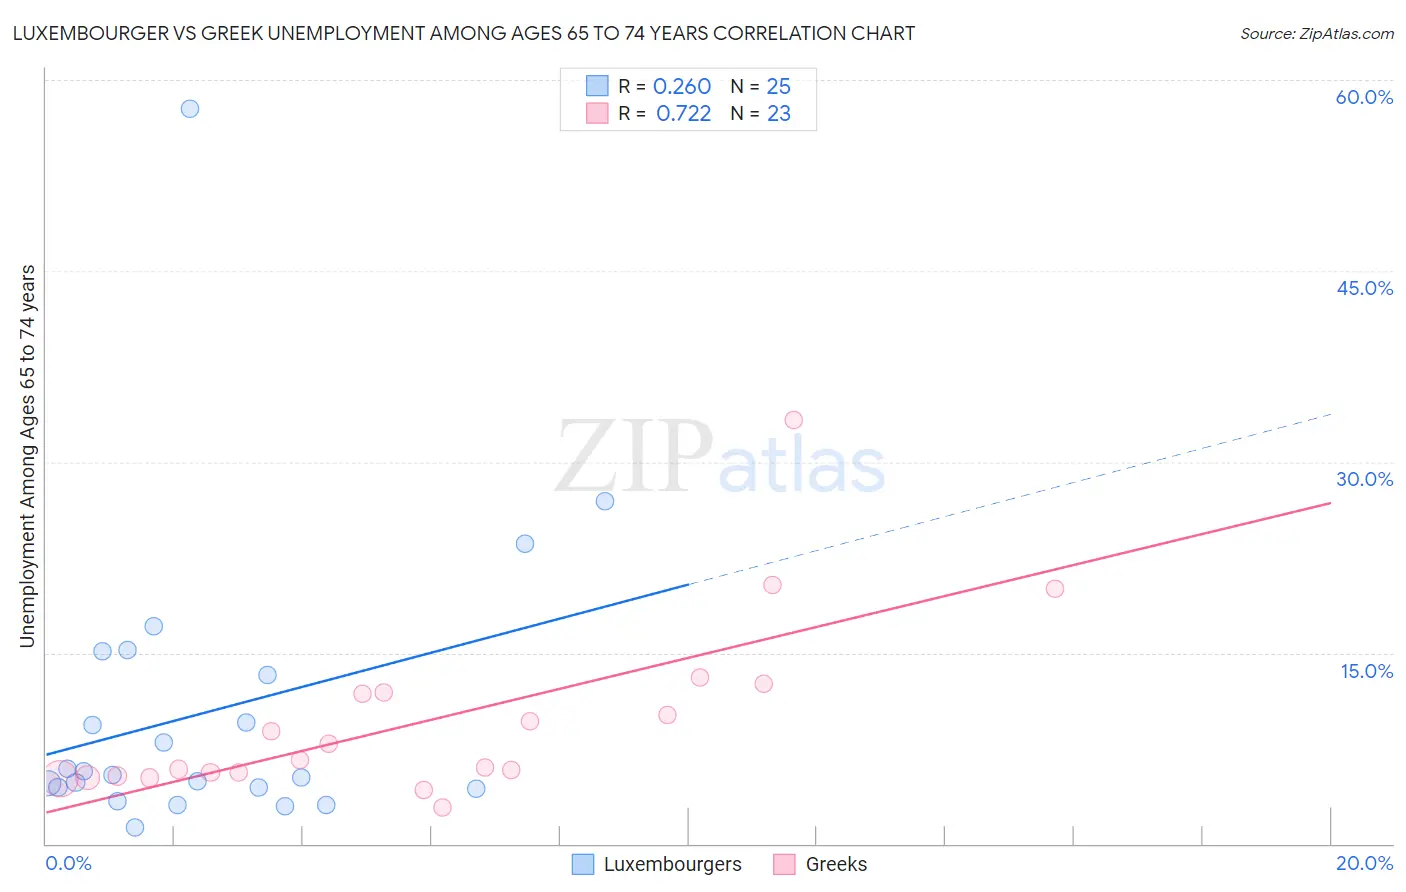
Luxembourger vs Greek Unemployment Among Ages 65 to 74 years Correlation Chart
The statistical analysis conducted on geographies consisting of 133,426,562 people shows a weak positive correlation between the proportion of Luxembourgers and unemployment rate among population between the ages 65 and 74 in the United States with a correlation coefficient (R) of 0.260 and weighted average of 5.2%. Similarly, the statistical analysis conducted on geographies consisting of 406,284,460 people shows a strong positive correlation between the proportion of Greeks and unemployment rate among population between the ages 65 and 74 in the United States with a correlation coefficient (R) of 0.722 and weighted average of 5.4%, a difference of 3.2%.
Unemployment Among Ages 65 to 74 years Correlation Summary
| Measurement | Luxembourger | Greek |
| Minimum | 1.2% | 2.8% |
| Maximum | 57.7% | 33.3% |
| Range | 56.5% | 30.5% |
| Mean | 10.4% | 9.7% |
| Median | 5.4% | 6.6% |
| Interquartile 25% (IQ1) | 4.4% | 5.3% |
| Interquartile 75% (IQ3) | 14.2% | 11.9% |
| Interquartile Range (IQR) | 9.8% | 6.6% |
| Standard Deviation (Sample) | 11.9% | 6.9% |
| Standard Deviation (Population) | 11.6% | 6.8% |
Similar Demographics by Unemployment Among Ages 65 to 74 years
Demographics Similar to Luxembourgers by Unemployment Among Ages 65 to 74 years
In terms of unemployment among ages 65 to 74 years, the demographic groups most similar to Luxembourgers are English (5.2%, a difference of 0.080%), Immigrants from Saudi Arabia (5.2%, a difference of 0.090%), Romanian (5.2%, a difference of 0.090%), Scottish (5.2%, a difference of 0.10%), and British (5.2%, a difference of 0.11%).
| Demographics | Rating | Rank | Unemployment Among Ages 65 to 74 years |
| Immigrants | Middle Africa | 98.4 /100 | #83 | Exceptional 5.2% |
| Immigrants | Hungary | 98.0 /100 | #84 | Exceptional 5.2% |
| British | 97.9 /100 | #85 | Exceptional 5.2% |
| Danes | 97.9 /100 | #86 | Exceptional 5.2% |
| Scottish | 97.9 /100 | #87 | Exceptional 5.2% |
| Immigrants | Saudi Arabia | 97.9 /100 | #88 | Exceptional 5.2% |
| English | 97.8 /100 | #89 | Exceptional 5.2% |
| Luxembourgers | 97.6 /100 | #90 | Exceptional 5.2% |
| Romanians | 97.4 /100 | #91 | Exceptional 5.2% |
| Puget Sound Salish | 97.3 /100 | #92 | Exceptional 5.2% |
| Immigrants | Netherlands | 97.1 /100 | #93 | Exceptional 5.2% |
| South Africans | 97.1 /100 | #94 | Exceptional 5.2% |
| Serbians | 97.0 /100 | #95 | Exceptional 5.2% |
| Immigrants | Thailand | 97.0 /100 | #96 | Exceptional 5.2% |
| Senegalese | 96.5 /100 | #97 | Exceptional 5.2% |
Demographics Similar to Greeks by Unemployment Among Ages 65 to 74 years
In terms of unemployment among ages 65 to 74 years, the demographic groups most similar to Greeks are Immigrants from Northern Europe (5.4%, a difference of 0.0%), Panamanian (5.4%, a difference of 0.020%), Potawatomi (5.4%, a difference of 0.040%), Immigrants from Iran (5.4%, a difference of 0.070%), and Syrian (5.4%, a difference of 0.090%).
| Demographics | Rating | Rank | Unemployment Among Ages 65 to 74 years |
| Immigrants | Bosnia and Herzegovina | 60.2 /100 | #165 | Good 5.3% |
| Slovaks | 60.0 /100 | #166 | Good 5.3% |
| Indians (Asian) | 59.9 /100 | #167 | Average 5.3% |
| Whites/Caucasians | 57.2 /100 | #168 | Average 5.4% |
| Laotians | 55.7 /100 | #169 | Average 5.4% |
| Syrians | 53.7 /100 | #170 | Average 5.4% |
| Panamanians | 51.8 /100 | #171 | Average 5.4% |
| Greeks | 51.1 /100 | #172 | Average 5.4% |
| Immigrants | Northern Europe | 51.1 /100 | #173 | Average 5.4% |
| Potawatomi | 50.0 /100 | #174 | Average 5.4% |
| Immigrants | Iran | 49.0 /100 | #175 | Average 5.4% |
| Immigrants | Western Europe | 47.3 /100 | #176 | Average 5.4% |
| Arabs | 46.8 /100 | #177 | Average 5.4% |
| French | 43.1 /100 | #178 | Average 5.4% |
| Guamanians/Chamorros | 42.1 /100 | #179 | Average 5.4% |