Lumbee vs Immigrants from Bosnia and Herzegovina Unemployment Among Women with Children Under 18 years
COMPARE
Lumbee
Immigrants from Bosnia and Herzegovina
Unemployment Among Women with Children Under 18 years
Unemployment Among Women with Children Under 18 years Comparison
Lumbee
Immigrants from Bosnia and Herzegovina
7.1%
UNEMPLOYMENT AMONG WOMEN WITH CHILDREN UNDER 18 YEARS
0.0/ 100
METRIC RATING
327th/ 347
METRIC RANK
5.0%
UNEMPLOYMENT AMONG WOMEN WITH CHILDREN UNDER 18 YEARS
99.0/ 100
METRIC RATING
41st/ 347
METRIC RANK
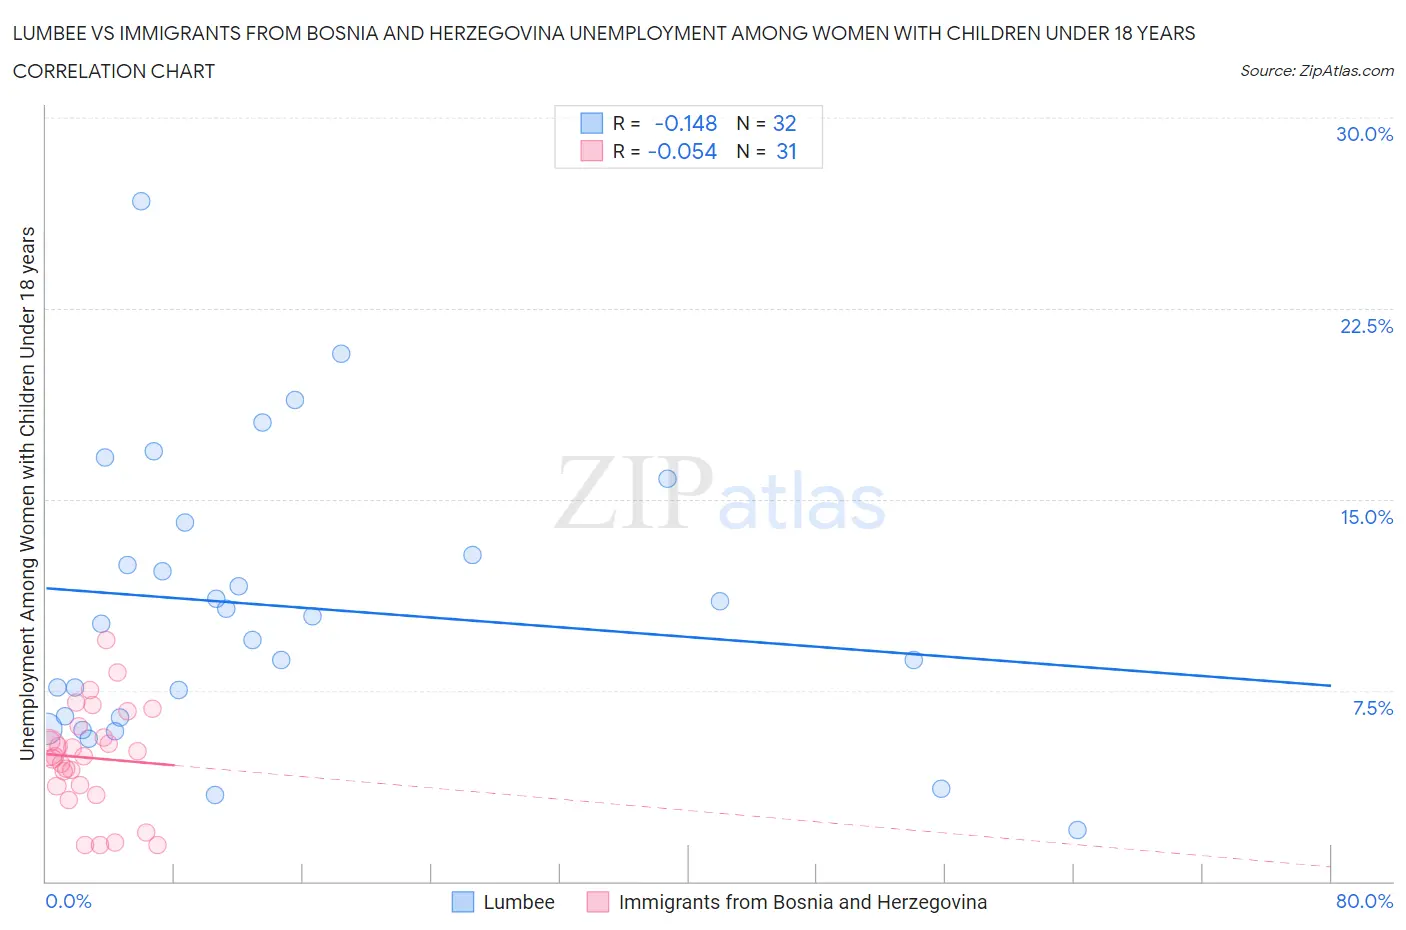
Lumbee vs Immigrants from Bosnia and Herzegovina Unemployment Among Women with Children Under 18 years Correlation Chart
The statistical analysis conducted on geographies consisting of 90,830,520 people shows a poor negative correlation between the proportion of Lumbee and unemployment rate among women with children under the age of 18 in the United States with a correlation coefficient (R) of -0.148 and weighted average of 7.1%. Similarly, the statistical analysis conducted on geographies consisting of 154,290,483 people shows a slight negative correlation between the proportion of Immigrants from Bosnia and Herzegovina and unemployment rate among women with children under the age of 18 in the United States with a correlation coefficient (R) of -0.054 and weighted average of 5.0%, a difference of 41.5%.
Unemployment Among Women with Children Under 18 years Correlation Summary
| Measurement | Lumbee | Immigrants from Bosnia and Herzegovina |
| Minimum | 2.0% | 1.4% |
| Maximum | 26.7% | 9.5% |
| Range | 24.7% | 8.1% |
| Mean | 10.8% | 4.8% |
| Median | 10.3% | 4.9% |
| Interquartile 25% (IQ1) | 6.5% | 3.7% |
| Interquartile 75% (IQ3) | 13.4% | 6.1% |
| Interquartile Range (IQR) | 7.0% | 2.3% |
| Standard Deviation (Sample) | 5.5% | 2.0% |
| Standard Deviation (Population) | 5.4% | 2.0% |
Similar Demographics by Unemployment Among Women with Children Under 18 years
Demographics Similar to Lumbee by Unemployment Among Women with Children Under 18 years
In terms of unemployment among women with children under 18 years, the demographic groups most similar to Lumbee are Chippewa (7.0%, a difference of 0.86%), Immigrants from Dominica (7.0%, a difference of 1.6%), Native/Alaskan (7.2%, a difference of 2.4%), Black/African American (7.3%, a difference of 2.8%), and Paiute (6.9%, a difference of 2.8%).
| Demographics | Rating | Rank | Unemployment Among Women with Children Under 18 years |
| Immigrants | Belize | 0.0 /100 | #320 | Tragic 6.7% |
| U.S. Virgin Islanders | 0.0 /100 | #321 | Tragic 6.7% |
| Houma | 0.0 /100 | #322 | Tragic 6.8% |
| Pueblo | 0.0 /100 | #323 | Tragic 6.8% |
| Paiute | 0.0 /100 | #324 | Tragic 6.9% |
| Immigrants | Dominica | 0.0 /100 | #325 | Tragic 7.0% |
| Chippewa | 0.0 /100 | #326 | Tragic 7.0% |
| Lumbee | 0.0 /100 | #327 | Tragic 7.1% |
| Natives/Alaskans | 0.0 /100 | #328 | Tragic 7.2% |
| Blacks/African Americans | 0.0 /100 | #329 | Tragic 7.3% |
| Colville | 0.0 /100 | #330 | Tragic 7.4% |
| Hopi | 0.0 /100 | #331 | Tragic 7.4% |
| Dominicans | 0.0 /100 | #332 | Tragic 7.5% |
| Immigrants | Dominican Republic | 0.0 /100 | #333 | Tragic 7.5% |
| Cheyenne | 0.0 /100 | #334 | Tragic 7.8% |
Demographics Similar to Immigrants from Bosnia and Herzegovina by Unemployment Among Women with Children Under 18 years
In terms of unemployment among women with children under 18 years, the demographic groups most similar to Immigrants from Bosnia and Herzegovina are Greek (5.0%, a difference of 0.060%), Eastern European (5.0%, a difference of 0.080%), Turkish (5.0%, a difference of 0.13%), Immigrants from Moldova (5.0%, a difference of 0.19%), and Immigrants from Malaysia (5.0%, a difference of 0.27%).
| Demographics | Rating | Rank | Unemployment Among Women with Children Under 18 years |
| Immigrants | South Central Asia | 99.2 /100 | #34 | Exceptional 5.0% |
| Luxembourgers | 99.2 /100 | #35 | Exceptional 5.0% |
| Mongolians | 99.2 /100 | #36 | Exceptional 5.0% |
| Poles | 99.2 /100 | #37 | Exceptional 5.0% |
| Bhutanese | 99.2 /100 | #38 | Exceptional 5.0% |
| English | 99.1 /100 | #39 | Exceptional 5.0% |
| Greeks | 99.0 /100 | #40 | Exceptional 5.0% |
| Immigrants | Bosnia and Herzegovina | 99.0 /100 | #41 | Exceptional 5.0% |
| Eastern Europeans | 98.9 /100 | #42 | Exceptional 5.0% |
| Turks | 98.9 /100 | #43 | Exceptional 5.0% |
| Immigrants | Moldova | 98.9 /100 | #44 | Exceptional 5.0% |
| Immigrants | Malaysia | 98.8 /100 | #45 | Exceptional 5.0% |
| Immigrants | Korea | 98.7 /100 | #46 | Exceptional 5.0% |
| British | 98.7 /100 | #47 | Exceptional 5.0% |
| Northern Europeans | 98.6 /100 | #48 | Exceptional 5.0% |