Lithuanian vs Immigrants from Ireland Unemployment Among Ages 55 to 59 years
COMPARE
Lithuanian
Immigrants from Ireland
Unemployment Among Ages 55 to 59 years
Unemployment Among Ages 55 to 59 years Comparison
Lithuanians
Immigrants from Ireland
4.7%
UNEMPLOYMENT AMONG AGES 55 TO 59 YEARS
88.8/ 100
METRIC RATING
124th/ 347
METRIC RANK
5.0%
UNEMPLOYMENT AMONG AGES 55 TO 59 YEARS
4.8/ 100
METRIC RATING
223rd/ 347
METRIC RANK
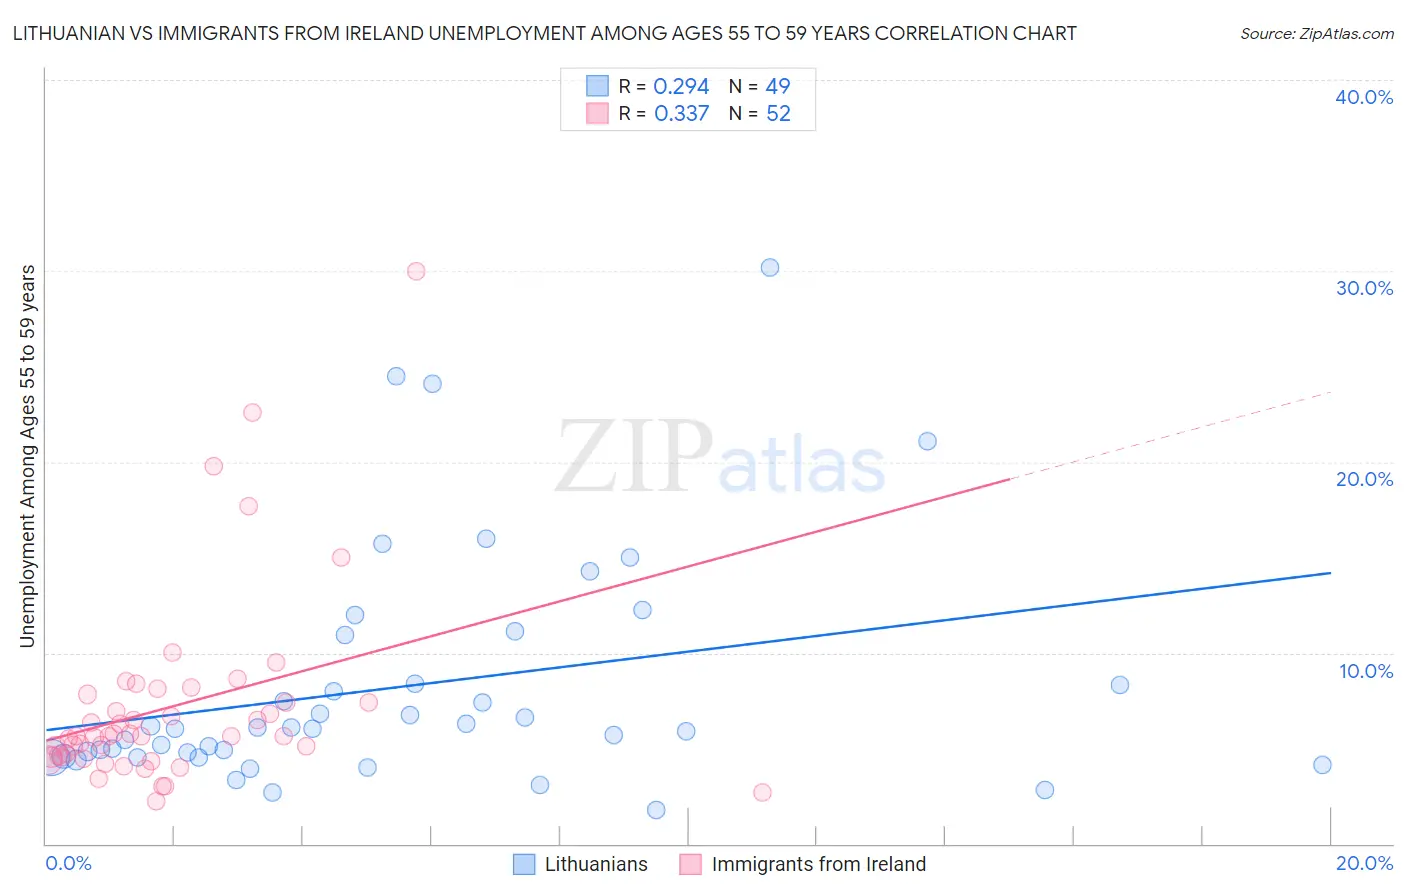
Lithuanian vs Immigrants from Ireland Unemployment Among Ages 55 to 59 years Correlation Chart
The statistical analysis conducted on geographies consisting of 386,833,182 people shows a weak positive correlation between the proportion of Lithuanians and unemployment rate among population between the ages 55 and 59 in the United States with a correlation coefficient (R) of 0.294 and weighted average of 4.7%. Similarly, the statistical analysis conducted on geographies consisting of 231,716,113 people shows a mild positive correlation between the proportion of Immigrants from Ireland and unemployment rate among population between the ages 55 and 59 in the United States with a correlation coefficient (R) of 0.337 and weighted average of 5.0%, a difference of 5.3%.
Unemployment Among Ages 55 to 59 years Correlation Summary
| Measurement | Lithuanian | Immigrants from Ireland |
| Minimum | 1.8% | 2.2% |
| Maximum | 30.2% | 30.0% |
| Range | 28.4% | 27.8% |
| Mean | 8.2% | 7.2% |
| Median | 6.0% | 5.6% |
| Interquartile 25% (IQ1) | 4.6% | 4.5% |
| Interquartile 75% (IQ3) | 9.7% | 7.6% |
| Interquartile Range (IQR) | 5.1% | 3.1% |
| Standard Deviation (Sample) | 6.1% | 5.1% |
| Standard Deviation (Population) | 6.1% | 5.1% |
Similar Demographics by Unemployment Among Ages 55 to 59 years
Demographics Similar to Lithuanians by Unemployment Among Ages 55 to 59 years
In terms of unemployment among ages 55 to 59 years, the demographic groups most similar to Lithuanians are Immigrants from Japan (4.7%, a difference of 0.060%), Immigrants from Afghanistan (4.7%, a difference of 0.070%), Pakistani (4.7%, a difference of 0.090%), Immigrants from Malaysia (4.7%, a difference of 0.10%), and Immigrants from South Africa (4.7%, a difference of 0.11%).
| Demographics | Rating | Rank | Unemployment Among Ages 55 to 59 years |
| Asians | 90.8 /100 | #117 | Exceptional 4.7% |
| Immigrants | Chile | 90.7 /100 | #118 | Exceptional 4.7% |
| Whites/Caucasians | 90.7 /100 | #119 | Exceptional 4.7% |
| Immigrants | South Africa | 89.9 /100 | #120 | Excellent 4.7% |
| Pakistanis | 89.7 /100 | #121 | Excellent 4.7% |
| Immigrants | Afghanistan | 89.5 /100 | #122 | Excellent 4.7% |
| Immigrants | Japan | 89.4 /100 | #123 | Excellent 4.7% |
| Lithuanians | 88.8 /100 | #124 | Excellent 4.7% |
| Immigrants | Malaysia | 87.9 /100 | #125 | Excellent 4.7% |
| Immigrants | Serbia | 87.8 /100 | #126 | Excellent 4.7% |
| Icelanders | 87.7 /100 | #127 | Excellent 4.7% |
| Pennsylvania Germans | 87.1 /100 | #128 | Excellent 4.7% |
| Immigrants | Sweden | 86.8 /100 | #129 | Excellent 4.7% |
| Greeks | 86.6 /100 | #130 | Excellent 4.7% |
| Immigrants | Thailand | 85.4 /100 | #131 | Excellent 4.7% |
Demographics Similar to Immigrants from Ireland by Unemployment Among Ages 55 to 59 years
In terms of unemployment among ages 55 to 59 years, the demographic groups most similar to Immigrants from Ireland are Spanish (5.0%, a difference of 0.070%), Subsaharan African (5.0%, a difference of 0.070%), Costa Rican (5.0%, a difference of 0.090%), Immigrants from China (5.0%, a difference of 0.13%), and Immigrants from Iran (5.0%, a difference of 0.26%).
| Demographics | Rating | Rank | Unemployment Among Ages 55 to 59 years |
| Spanish Americans | 8.1 /100 | #216 | Tragic 4.9% |
| Immigrants | Brazil | 8.1 /100 | #217 | Tragic 4.9% |
| Immigrants | Austria | 8.0 /100 | #218 | Tragic 4.9% |
| Immigrants | Nigeria | 8.0 /100 | #219 | Tragic 4.9% |
| Indians (Asian) | 7.6 /100 | #220 | Tragic 4.9% |
| Nigerians | 7.5 /100 | #221 | Tragic 4.9% |
| Spanish | 5.1 /100 | #222 | Tragic 5.0% |
| Immigrants | Ireland | 4.8 /100 | #223 | Tragic 5.0% |
| Sub-Saharan Africans | 4.4 /100 | #224 | Tragic 5.0% |
| Costa Ricans | 4.4 /100 | #225 | Tragic 5.0% |
| Immigrants | China | 4.2 /100 | #226 | Tragic 5.0% |
| Immigrants | Iran | 3.7 /100 | #227 | Tragic 5.0% |
| Immigrants | Liberia | 3.2 /100 | #228 | Tragic 5.0% |
| Immigrants | Western Asia | 3.0 /100 | #229 | Tragic 5.0% |
| Immigrants | Syria | 2.7 /100 | #230 | Tragic 5.0% |