Liberian vs Immigrants from Lebanon Unemployment Among Ages 65 to 74 years
COMPARE
Liberian
Immigrants from Lebanon
Unemployment Among Ages 65 to 74 years
Unemployment Among Ages 65 to 74 years Comparison
Liberians
Immigrants from Lebanon
5.8%
UNEMPLOYMENT AMONG AGES 65 TO 74 YEARS
0.0/ 100
METRIC RATING
302nd/ 347
METRIC RANK
5.0%
UNEMPLOYMENT AMONG AGES 65 TO 74 YEARS
100.0/ 100
METRIC RATING
30th/ 347
METRIC RANK
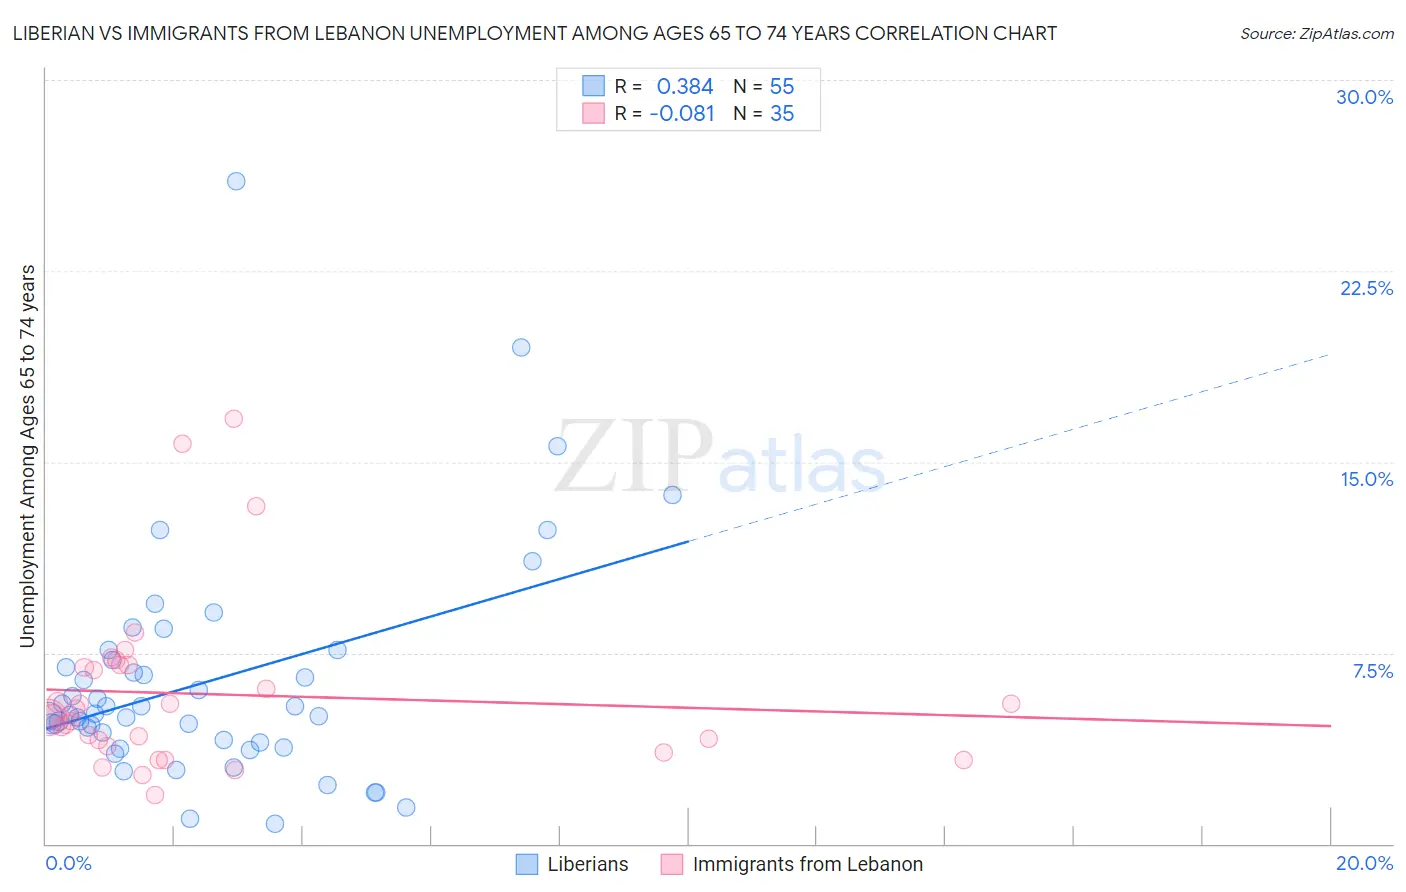
Liberian vs Immigrants from Lebanon Unemployment Among Ages 65 to 74 years Correlation Chart
The statistical analysis conducted on geographies consisting of 112,457,938 people shows a mild positive correlation between the proportion of Liberians and unemployment rate among population between the ages 65 and 74 in the United States with a correlation coefficient (R) of 0.384 and weighted average of 5.8%. Similarly, the statistical analysis conducted on geographies consisting of 206,337,503 people shows a slight negative correlation between the proportion of Immigrants from Lebanon and unemployment rate among population between the ages 65 and 74 in the United States with a correlation coefficient (R) of -0.081 and weighted average of 5.0%, a difference of 16.8%.
Unemployment Among Ages 65 to 74 years Correlation Summary
| Measurement | Liberian | Immigrants from Lebanon |
| Minimum | 0.80% | 1.9% |
| Maximum | 26.0% | 16.7% |
| Range | 25.2% | 14.8% |
| Mean | 6.4% | 5.9% |
| Median | 5.1% | 5.0% |
| Interquartile 25% (IQ1) | 4.0% | 3.9% |
| Interquartile 75% (IQ3) | 7.2% | 7.0% |
| Interquartile Range (IQR) | 3.2% | 3.2% |
| Standard Deviation (Sample) | 4.5% | 3.3% |
| Standard Deviation (Population) | 4.4% | 3.3% |
Similar Demographics by Unemployment Among Ages 65 to 74 years
Demographics Similar to Liberians by Unemployment Among Ages 65 to 74 years
In terms of unemployment among ages 65 to 74 years, the demographic groups most similar to Liberians are Arapaho (5.8%, a difference of 0.020%), Salvadoran (5.8%, a difference of 0.030%), Mexican (5.8%, a difference of 0.040%), Cheyenne (5.8%, a difference of 0.040%), and British West Indian (5.8%, a difference of 0.050%).
| Demographics | Rating | Rank | Unemployment Among Ages 65 to 74 years |
| Blacks/African Americans | 0.0 /100 | #295 | Tragic 5.8% |
| Pennsylvania Germans | 0.0 /100 | #296 | Tragic 5.8% |
| Houma | 0.0 /100 | #297 | Tragic 5.8% |
| Immigrants | Latin America | 0.0 /100 | #298 | Tragic 5.8% |
| Barbadians | 0.0 /100 | #299 | Tragic 5.8% |
| Ecuadorians | 0.0 /100 | #300 | Tragic 5.8% |
| Armenians | 0.0 /100 | #301 | Tragic 5.8% |
| Liberians | 0.0 /100 | #302 | Tragic 5.8% |
| Arapaho | 0.0 /100 | #303 | Tragic 5.8% |
| Salvadorans | 0.0 /100 | #304 | Tragic 5.8% |
| Mexicans | 0.0 /100 | #305 | Tragic 5.8% |
| Cheyenne | 0.0 /100 | #306 | Tragic 5.8% |
| British West Indians | 0.0 /100 | #307 | Tragic 5.8% |
| Guatemalans | 0.0 /100 | #308 | Tragic 5.8% |
| Immigrants | Ecuador | 0.0 /100 | #309 | Tragic 5.8% |
Demographics Similar to Immigrants from Lebanon by Unemployment Among Ages 65 to 74 years
In terms of unemployment among ages 65 to 74 years, the demographic groups most similar to Immigrants from Lebanon are Ethiopian (5.0%, a difference of 0.090%), Slovene (5.0%, a difference of 0.10%), Palestinian (5.0%, a difference of 0.38%), Belgian (5.0%, a difference of 0.43%), and Cambodian (5.0%, a difference of 0.43%).
| Demographics | Rating | Rank | Unemployment Among Ages 65 to 74 years |
| Immigrants | Nepal | 100.0 /100 | #23 | Exceptional 4.9% |
| Iraqis | 100.0 /100 | #24 | Exceptional 4.9% |
| Macedonians | 100.0 /100 | #25 | Exceptional 5.0% |
| Czechs | 100.0 /100 | #26 | Exceptional 5.0% |
| Norwegians | 100.0 /100 | #27 | Exceptional 5.0% |
| Bulgarians | 100.0 /100 | #28 | Exceptional 5.0% |
| Ethiopians | 100.0 /100 | #29 | Exceptional 5.0% |
| Immigrants | Lebanon | 100.0 /100 | #30 | Exceptional 5.0% |
| Slovenes | 100.0 /100 | #31 | Exceptional 5.0% |
| Palestinians | 100.0 /100 | #32 | Exceptional 5.0% |
| Belgians | 100.0 /100 | #33 | Exceptional 5.0% |
| Cambodians | 100.0 /100 | #34 | Exceptional 5.0% |
| Bhutanese | 100.0 /100 | #35 | Exceptional 5.0% |
| Immigrants | Kuwait | 99.9 /100 | #36 | Exceptional 5.0% |
| Immigrants | Eastern Africa | 99.9 /100 | #37 | Exceptional 5.0% |