Lebanese vs Immigrants from Barbados Unemployment Among Ages 25 to 29 years

COMPARE

Lebanese
Race
Ancestry
AfghanAfricanAlaska NativeAlaskan AthabascanAlbanianAleutAlsatianAmericanApacheArabArapahoArgentineanArmenianAssyrian/Chaldean/SyriacAustralianAustrianBahamianBangladeshiBarbadianBasqueBelgianBelizeanBermudanBhutaneseBlackfeetBolivianBrazilianBritishBritish West IndianBulgarianBurmeseCajunCambodianCanadianCape VerdeanCarpatho RusynCelticCentral AmericanCentral American IndianCherokeeCheyenneChickasawChileanChineseChippewaChoctawColombianColvilleComancheCosta RicanCreeCreekCroatianCrowCubanCypriotCzechCzechoslovakianDanishDelawareDominicanDutchDutch West IndianEastern EuropeanEcuadorianEgyptianEnglishEstonianEthiopianEuropeanFijianFilipinoFinnishFrenchFrench American IndianFrench CanadianGermanGerman RussianGhanaianGreekGuamanian/ChamorroGuatemalanGuyaneseHaitianHmongHonduranHopiHoumaHungarianIcelanderIndian (Asian)IndonesianInupiatIranianIraqiIrishIroquoisIsraeliItalianJamaicanJapaneseJordanianKenyanKiowaKoreanLaotianLatvianLebaneseLiberianLithuanianLumbeeLuxembourgerMacedonianMalaysianMalteseMarshalleseMenomineeMexicanMexican American IndianMongolianMoroccanNative HawaiianNavajoNepaleseNew ZealanderNicaraguanNigerianNorthern EuropeanNorwegianOkinawanOsageOttawaPaiutePakistaniPalestinianPanamanianParaguayanPennsylvania GermanPeruvianPimaPolishPortuguesePotawatomiPuebloPuerto RicanPuget Sound SalishRomanianRussianSalvadoranSamoanScandinavianScotch-IrishScottishSeminoleSenegaleseSerbianShoshoneSierra LeoneanSiouxSlavicSlovakSloveneSomaliSouth AfricanSouth AmericanSouth American IndianSoviet UnionSpaniardSpanishSpanish AmericanSpanish American IndianSri LankanSubsaharan AfricanSudaneseSwedishSwissSyrianTaiwaneseThaiTlingit-HaidaTohono O'OdhamTonganTrinidadian and TobagonianTsimshianTurkishU.S. Virgin IslanderUgandanUkrainianUruguayanUteVenezuelanVietnameseWelshWest IndianYakamaYaquiYugoslavianYumanYup'ikZimbabwean
Immigration
NonimmigrantsImmigrantsAfghanistanAfricaAlbaniaArgentinaArmeniaAsiaAustraliaAustriaBahamasBangladeshBelarusBelgiumBelizeBoliviaBosnia and HerzegovinaBrazilBulgariaBurma/MyanmarCabo VerdeCambodiaCameroonCanadaCaribbeanCentral AmericaChileChinaColombiaCongoCosta RicaCroatiaCubaCzechoslovakiaDenmarkDominicaDominican RepublicEastern AfricaEastern AsiaEastern EuropeEcuadorEgyptEl SalvadorEnglandEritreaEthiopiaEuropeFijiFranceGermanyGhanaGreeceGrenadaGuatemalaGuyanaHaitiHondurasHong KongHungaryIndiaIndonesiaIranIraqIrelandIsraelItalyJamaicaJapanJordanKazakhstanKenyaKoreaKuwaitLaosLatin AmericaLatviaLebanonLiberiaLithuaniaMalaysiaMexicoMicronesiaMiddle AfricaMoldovaMoroccoNepalNetherlandsNicaraguaNigeriaNorth AmericaNorth MacedoniaNorthern AfricaNorthern EuropeNorwayOceaniaPakistanPanamaPeruPhilippinesPolandPortugalRomaniaRussiaSaudi ArabiaScotlandSenegalSerbiaSierra LeoneSingaporeSomaliaSouth AfricaSouth AmericaSouth Central AsiaSouth Eastern AsiaSouthern EuropeSpainSri LankaSt. Vincent and the GrenadinesSudanSwedenSwitzerlandSyriaTaiwanThailandTrinidad and TobagoTurkeyUgandaUkraineUruguayUzbekistanVenezuelaVietnamWest IndiesWestern AfricaWestern AsiaWestern EuropeYemenZaireZimbabweAzores
Immigrants from Barbados
Race
Ancestry
AfghanAfricanAlaska NativeAlaskan AthabascanAlbanianAleutAlsatianAmericanApacheArabArapahoArgentineanArmenianAssyrian/Chaldean/SyriacAustralianAustrianBahamianBangladeshiBarbadianBasqueBelgianBelizeanBermudanBhutaneseBlackfeetBolivianBrazilianBritishBritish West IndianBulgarianBurmeseCajunCambodianCanadianCape VerdeanCarpatho RusynCelticCentral AmericanCentral American IndianCherokeeCheyenneChickasawChileanChineseChippewaChoctawColombianColvilleComancheCosta RicanCreeCreekCroatianCrowCubanCypriotCzechCzechoslovakianDanishDelawareDominicanDutchDutch West IndianEastern EuropeanEcuadorianEgyptianEnglishEstonianEthiopianEuropeanFijianFilipinoFinnishFrenchFrench American IndianFrench CanadianGermanGerman RussianGhanaianGreekGuamanian/ChamorroGuatemalanGuyaneseHaitianHmongHonduranHopiHoumaHungarianIcelanderIndian (Asian)IndonesianInupiatIranianIraqiIrishIroquoisIsraeliItalianJamaicanJapaneseJordanianKenyanKiowaKoreanLaotianLatvianLiberianLithuanianLumbeeLuxembourgerMacedonianMalaysianMalteseMarshalleseMenomineeMexicanMexican American IndianMongolianMoroccanNative HawaiianNavajoNepaleseNew ZealanderNicaraguanNigerianNorthern EuropeanNorwegianOkinawanOsageOttawaPaiutePakistaniPalestinianPanamanianParaguayanPennsylvania GermanPeruvianPimaPolishPortuguesePotawatomiPuebloPuerto RicanPuget Sound SalishRomanianRussianSalvadoranSamoanScandinavianScotch-IrishScottishSeminoleSenegaleseSerbianShoshoneSierra LeoneanSiouxSlavicSlovakSloveneSomaliSouth AfricanSouth AmericanSouth American IndianSoviet UnionSpaniardSpanishSpanish AmericanSpanish American IndianSri LankanSubsaharan AfricanSudaneseSwedishSwissSyrianTaiwaneseThaiTlingit-HaidaTohono O'OdhamTonganTrinidadian and TobagonianTsimshianTurkishU.S. Virgin IslanderUgandanUkrainianUruguayanUteVenezuelanVietnameseWelshWest IndianYakamaYaquiYugoslavianYumanYup'ikZimbabwean
Immigration
NonimmigrantsImmigrantsAfghanistanAfricaAlbaniaArgentinaArmeniaAsiaAustraliaAustriaBahamasBangladeshBarbadosBelarusBelgiumBelizeBoliviaBosnia and HerzegovinaBrazilBulgariaBurma/MyanmarCabo VerdeCambodiaCameroonCanadaCaribbeanCentral AmericaChileChinaColombiaCongoCosta RicaCroatiaCubaCzechoslovakiaDenmarkDominicaDominican RepublicEastern AfricaEastern AsiaEastern EuropeEcuadorEgyptEl SalvadorEnglandEritreaEthiopiaEuropeFijiFranceGermanyGhanaGreeceGrenadaGuatemalaGuyanaHaitiHondurasHong KongHungaryIndiaIndonesiaIranIraqIrelandIsraelItalyJamaicaJapanJordanKazakhstanKenyaKoreaKuwaitLaosLatin AmericaLatviaLebanonLiberiaLithuaniaMalaysiaMexicoMicronesiaMiddle AfricaMoldovaMoroccoNepalNetherlandsNicaraguaNigeriaNorth AmericaNorth MacedoniaNorthern AfricaNorthern EuropeNorwayOceaniaPakistanPanamaPeruPhilippinesPolandPortugalRomaniaRussiaSaudi ArabiaScotlandSenegalSerbiaSierra LeoneSingaporeSomaliaSouth AfricaSouth AmericaSouth Central AsiaSouth Eastern AsiaSouthern EuropeSpainSri LankaSt. Vincent and the GrenadinesSudanSwedenSwitzerlandSyriaTaiwanThailandTrinidad and TobagoTurkeyUgandaUkraineUruguayUzbekistanVenezuelaVietnamWest IndiesWestern AfricaWestern AsiaWestern EuropeYemenZaireZimbabweAzores
Unemployment Among Ages 25 to 29 years
Income
Poverty
Unemployment
Labor Participation
Family Structure
Vehicle Availability
Education Level
Disability

Unemployment Among Ages 25 to 29 years Comparison

Lebanese

Immigrants from Barbados

Exceptional
Tragic
6.4%
UNEMPLOYMENT AMONG AGES 25 TO 29 YEARS
93.9/ 100
METRIC RATING
90th/ 347
METRIC RANK
8.0%
UNEMPLOYMENT AMONG AGES 25 TO 29 YEARS
0.0/ 100
METRIC RATING
307th/ 347
METRIC RANK

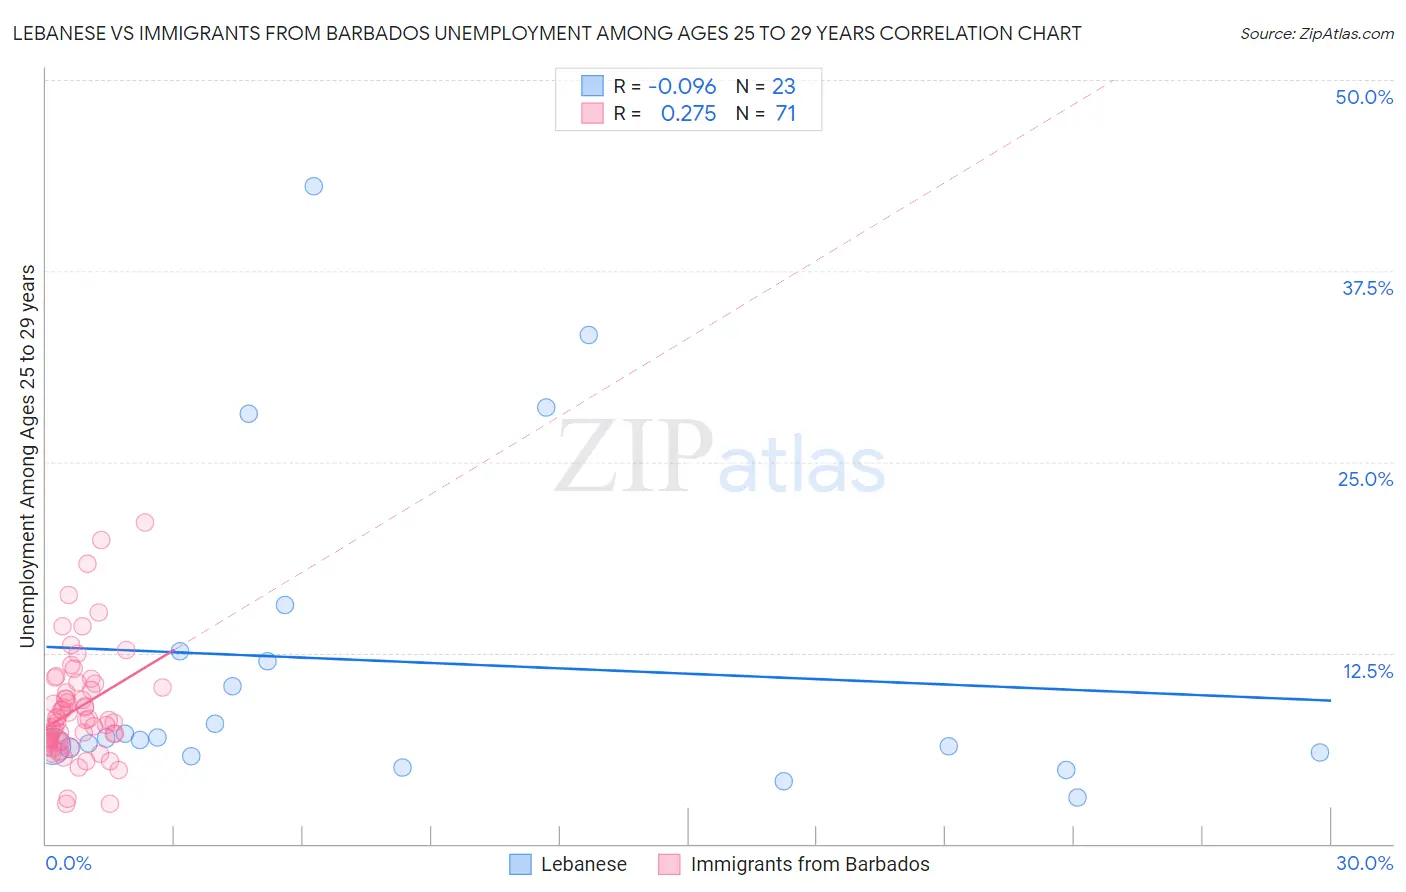
Lebanese vs Immigrants from Barbados Unemployment Among Ages 25 to 29 years Correlation Chart

The statistical analysis conducted on geographies consisting of 380,818,833 people shows a slight negative correlation between the proportion of Lebanese and unemployment rate among population between the ages 25 and 29 in the United States with a correlation coefficient (R) of -0.096 and weighted average of 6.4%. Similarly, the statistical analysis conducted on geographies consisting of 111,437,258 people shows a weak positive correlation between the proportion of Immigrants from Barbados and unemployment rate among population between the ages 25 and 29 in the United States with a correlation coefficient (R) of 0.275 and weighted average of 8.0%, a difference of 26.4%.
Lebanese vs Immigrants from Barbados Unemployment Among Ages 25 to 29 years

Unemployment Among Ages 25 to 29 years Correlation Summary

MeasurementLebaneseImmigrants from Barbados
Minimum3.0%2.6%
Maximum43.0%21.0%
Range40.0%18.4%
Mean11.9%8.8%
Median6.9%8.1%
Interquartile 25% (IQ1)6.0%6.7%
Interquartile 75% (IQ3)12.6%10.2%
Interquartile Range (IQR)6.6%3.5%
Standard Deviation (Sample)10.7%3.6%
Standard Deviation (Population)10.5%3.5%

Similar Demographics by Unemployment Among Ages 25 to 29 years

Demographics Similar to Lebanese by Unemployment Among Ages 25 to 29 years

In terms of unemployment among ages 25 to 29 years, the demographic groups most similar to Lebanese are Egyptian (6.4%, a difference of 0.010%), Immigrants from Oceania (6.4%, a difference of 0.070%), Immigrants from North Macedonia (6.4%, a difference of 0.070%), Australian (6.4%, a difference of 0.070%), and Zimbabwean (6.4%, a difference of 0.12%).
DemographicsRating | RankUnemployment Among Ages 25 to 29 years
Slovenes
95.3
/100
|
#83
Exceptional
6.3%
Immigrants | Spain
95.2
/100
|
#84
Exceptional
6.3%
Immigrants | Sweden
95.1
/100
|
#85
Exceptional
6.3%
Immigrants | Asia
94.9
/100
|
#86
Exceptional
6.3%
Marshallese
94.7
/100
|
#87
Exceptional
6.4%
Immigrants | Indonesia
94.5
/100
|
#88
Exceptional
6.4%
Immigrants | Oceania
94.1
/100
|
#89
Exceptional
6.4%
Lebanese
93.9
/100
|
#90
Exceptional
6.4%
Egyptians
93.9
/100
|
#91
Exceptional
6.4%
Immigrants | North Macedonia
93.6
/100
|
#92
Exceptional
6.4%
Australians
93.6
/100
|
#93
Exceptional
6.4%
Zimbabweans
93.5
/100
|
#94
Exceptional
6.4%
Afghans
92.5
/100
|
#95
Exceptional
6.4%
Immigrants | Brazil
92.1
/100
|
#96
Exceptional
6.4%
Immigrants | Eastern Europe
91.9
/100
|
#97
Exceptional
6.4%

Demographics Similar to Immigrants from Barbados by Unemployment Among Ages 25 to 29 years

In terms of unemployment among ages 25 to 29 years, the demographic groups most similar to Immigrants from Barbados are Haitian (8.0%, a difference of 0.16%), Tsimshian (8.0%, a difference of 0.24%), Immigrants from Jamaica (8.1%, a difference of 0.42%), Immigrants from Haiti (8.1%, a difference of 0.43%), and U.S. Virgin Islander (8.1%, a difference of 0.44%).
DemographicsRating | RankUnemployment Among Ages 25 to 29 years
Central American Indians
0.0
/100
|
#300
Tragic
7.9%
West Indians
0.0
/100
|
#301
Tragic
7.9%
Jamaicans
0.0
/100
|
#302
Tragic
7.9%
Immigrants | Yemen
0.0
/100
|
#303
Tragic
8.0%
Cajuns
0.0
/100
|
#304
Tragic
8.0%
Tsimshian
0.0
/100
|
#305
Tragic
8.0%
Haitians
0.0
/100
|
#306
Tragic
8.0%
Immigrants | Barbados
0.0
/100
|
#307
Tragic
8.0%
Immigrants | Jamaica
0.0
/100
|
#308
Tragic
8.1%
Immigrants | Haiti
0.0
/100
|
#309
Tragic
8.1%
U.S. Virgin Islanders
0.0
/100
|
#310
Tragic
8.1%
Immigrants | Azores
0.0
/100
|
#311
Tragic
8.1%
Dutch West Indians
0.0
/100
|
#312
Tragic
8.2%
Immigrants | St. Vincent and the Grenadines
0.0
/100
|
#313
Tragic
8.4%
Immigrants | Dominica
0.0
/100
|
#314
Tragic
8.4%