Latvian vs Ghanaian Unemployment
COMPARE
Latvian
Ghanaian
Unemployment
Unemployment Comparison
Latvians
Ghanaians
4.7%
UNEMPLOYMENT
99.9/ 100
METRIC RATING
25th/ 347
METRIC RANK
6.0%
UNEMPLOYMENT
0.0/ 100
METRIC RATING
278th/ 347
METRIC RANK
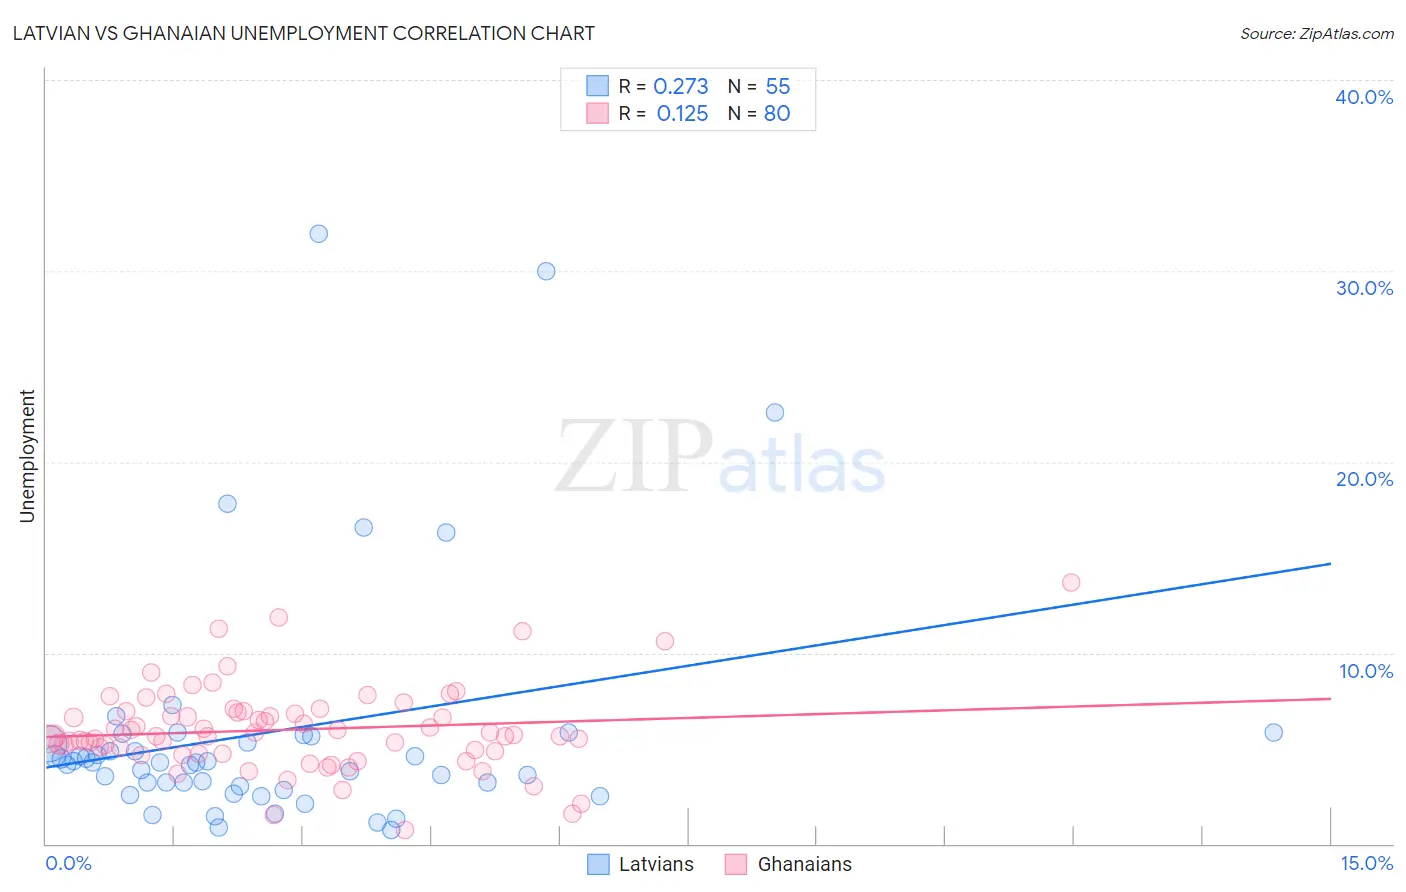
Latvian vs Ghanaian Unemployment Correlation Chart
The statistical analysis conducted on geographies consisting of 220,638,236 people shows a weak positive correlation between the proportion of Latvians and unemployment in the United States with a correlation coefficient (R) of 0.273 and weighted average of 4.7%. Similarly, the statistical analysis conducted on geographies consisting of 190,676,370 people shows a poor positive correlation between the proportion of Ghanaians and unemployment in the United States with a correlation coefficient (R) of 0.125 and weighted average of 6.0%, a difference of 27.2%.
Unemployment Correlation Summary
| Measurement | Latvian | Ghanaian |
| Minimum | 0.70% | 0.70% |
| Maximum | 32.0% | 13.7% |
| Range | 31.3% | 13.0% |
| Mean | 5.9% | 6.0% |
| Median | 4.3% | 5.6% |
| Interquartile 25% (IQ1) | 3.0% | 4.8% |
| Interquartile 75% (IQ3) | 5.6% | 6.9% |
| Interquartile Range (IQR) | 2.6% | 2.1% |
| Standard Deviation (Sample) | 6.4% | 2.2% |
| Standard Deviation (Population) | 6.4% | 2.2% |
Similar Demographics by Unemployment
Demographics Similar to Latvians by Unemployment
In terms of unemployment, the demographic groups most similar to Latvians are Bulgarian (4.7%, a difference of 0.040%), Venezuelan (4.7%, a difference of 0.070%), British (4.7%, a difference of 0.15%), Finnish (4.7%, a difference of 0.25%), and Welsh (4.7%, a difference of 0.45%).
| Demographics | Rating | Rank | Unemployment |
| Immigrants | Venezuela | 99.9 /100 | #18 | Exceptional 4.7% |
| Scottish | 99.9 /100 | #19 | Exceptional 4.7% |
| Carpatho Rusyns | 99.9 /100 | #20 | Exceptional 4.7% |
| Welsh | 99.9 /100 | #21 | Exceptional 4.7% |
| Thais | 99.9 /100 | #22 | Exceptional 4.7% |
| British | 99.9 /100 | #23 | Exceptional 4.7% |
| Venezuelans | 99.9 /100 | #24 | Exceptional 4.7% |
| Latvians | 99.9 /100 | #25 | Exceptional 4.7% |
| Bulgarians | 99.9 /100 | #26 | Exceptional 4.7% |
| Finns | 99.9 /100 | #27 | Exceptional 4.7% |
| Cubans | 99.8 /100 | #28 | Exceptional 4.7% |
| Poles | 99.8 /100 | #29 | Exceptional 4.7% |
| Irish | 99.8 /100 | #30 | Exceptional 4.8% |
| Croatians | 99.8 /100 | #31 | Exceptional 4.8% |
| Zimbabweans | 99.8 /100 | #32 | Exceptional 4.8% |
Demographics Similar to Ghanaians by Unemployment
In terms of unemployment, the demographic groups most similar to Ghanaians are Armenian (6.0%, a difference of 0.29%), Immigrants from Mexico (6.0%, a difference of 0.43%), Immigrants from Western Africa (6.0%, a difference of 0.43%), Immigrants from Central America (6.0%, a difference of 0.64%), and Immigrants from Latin America (5.9%, a difference of 0.93%).
| Demographics | Rating | Rank | Unemployment |
| Mexicans | 0.1 /100 | #271 | Tragic 5.9% |
| Hispanics or Latinos | 0.0 /100 | #272 | Tragic 5.9% |
| Immigrants | Fiji | 0.0 /100 | #273 | Tragic 5.9% |
| Bahamians | 0.0 /100 | #274 | Tragic 5.9% |
| Immigrants | Latin America | 0.0 /100 | #275 | Tragic 5.9% |
| Immigrants | Central America | 0.0 /100 | #276 | Tragic 6.0% |
| Armenians | 0.0 /100 | #277 | Tragic 6.0% |
| Ghanaians | 0.0 /100 | #278 | Tragic 6.0% |
| Immigrants | Mexico | 0.0 /100 | #279 | Tragic 6.0% |
| Immigrants | Western Africa | 0.0 /100 | #280 | Tragic 6.0% |
| Africans | 0.0 /100 | #281 | Tragic 6.1% |
| Immigrants | Azores | 0.0 /100 | #282 | Tragic 6.1% |
| Immigrants | Ghana | 0.0 /100 | #283 | Tragic 6.1% |
| Aleuts | 0.0 /100 | #284 | Tragic 6.1% |
| Immigrants | Senegal | 0.0 /100 | #285 | Tragic 6.1% |