Laotian vs Panamanian Unemployment Among Ages 60 to 64 years
COMPARE
Laotian
Panamanian
Unemployment Among Ages 60 to 64 years
Unemployment Among Ages 60 to 64 years Comparison
Laotians
Panamanians
4.8%
UNEMPLOYMENT AMONG AGES 60 TO 64 YEARS
66.8/ 100
METRIC RATING
157th/ 347
METRIC RANK
4.8%
UNEMPLOYMENT AMONG AGES 60 TO 64 YEARS
85.5/ 100
METRIC RATING
141st/ 347
METRIC RANK
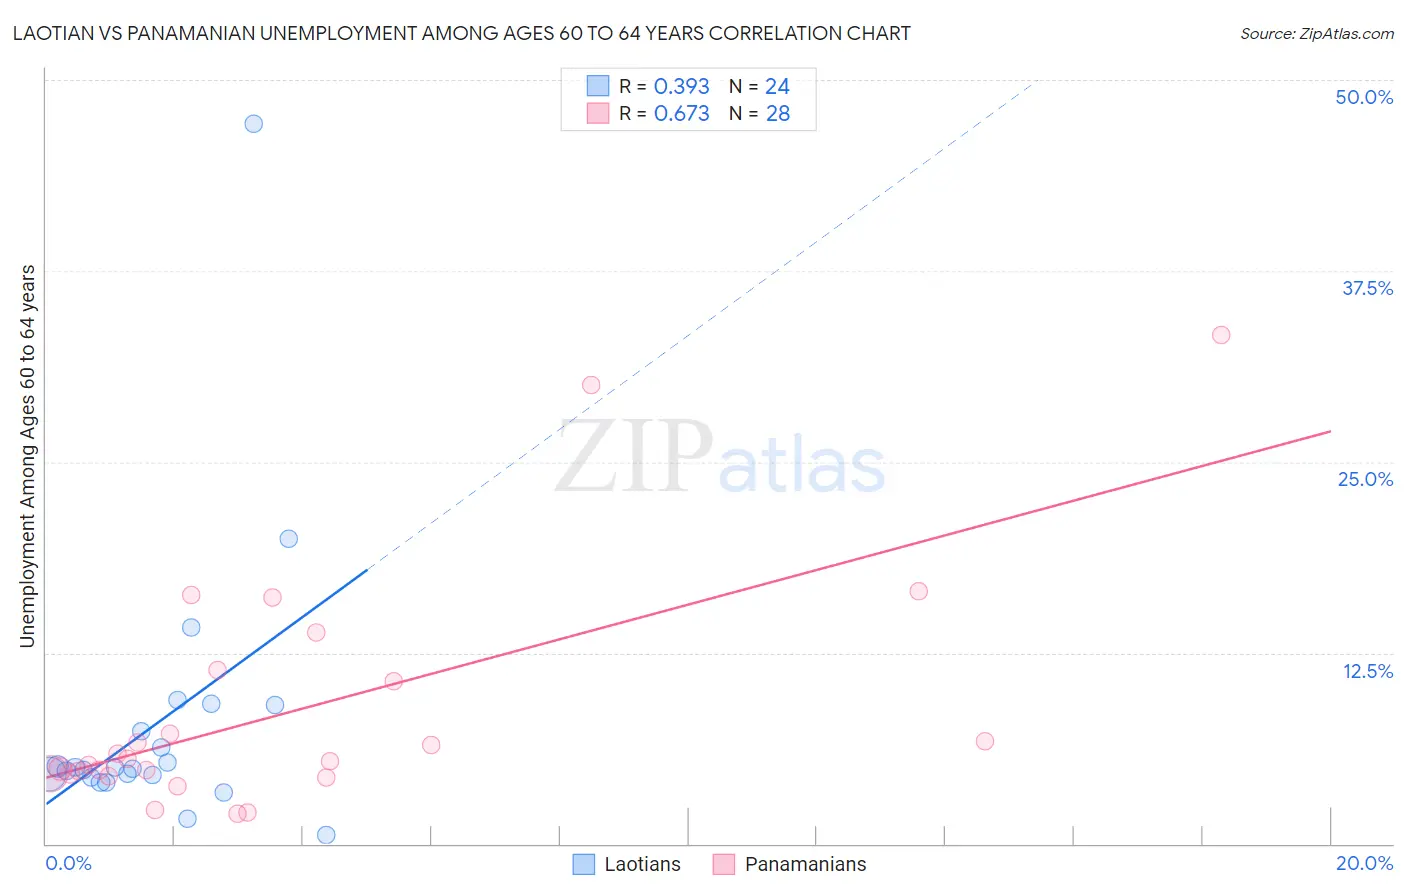
Laotian vs Panamanian Unemployment Among Ages 60 to 64 years Correlation Chart
The statistical analysis conducted on geographies consisting of 213,276,027 people shows a mild positive correlation between the proportion of Laotians and unemployment rate among population between the ages 60 and 64 in the United States with a correlation coefficient (R) of 0.393 and weighted average of 4.8%. Similarly, the statistical analysis conducted on geographies consisting of 262,466,273 people shows a significant positive correlation between the proportion of Panamanians and unemployment rate among population between the ages 60 and 64 in the United States with a correlation coefficient (R) of 0.673 and weighted average of 4.8%, a difference of 0.96%.
Unemployment Among Ages 60 to 64 years Correlation Summary
| Measurement | Laotian | Panamanian |
| Minimum | 0.60% | 2.0% |
| Maximum | 47.2% | 33.3% |
| Range | 46.6% | 31.3% |
| Mean | 7.9% | 8.7% |
| Median | 4.9% | 5.5% |
| Interquartile 25% (IQ1) | 4.4% | 4.6% |
| Interquartile 75% (IQ3) | 8.2% | 11.0% |
| Interquartile Range (IQR) | 3.8% | 6.4% |
| Standard Deviation (Sample) | 9.3% | 7.7% |
| Standard Deviation (Population) | 9.1% | 7.6% |
Demographics Similar to Laotians and Panamanians by Unemployment Among Ages 60 to 64 years
In terms of unemployment among ages 60 to 64 years, the demographic groups most similar to Laotians are Immigrants from Taiwan (4.8%, a difference of 0.040%), Spanish (4.8%, a difference of 0.050%), Immigrants from Bolivia (4.8%, a difference of 0.090%), Filipino (4.8%, a difference of 0.22%), and Chilean (4.8%, a difference of 0.25%). Similarly, the demographic groups most similar to Panamanians are Immigrants from Ethiopia (4.8%, a difference of 0.010%), Pima (4.8%, a difference of 0.020%), Italian (4.8%, a difference of 0.030%), Immigrants from Africa (4.8%, a difference of 0.090%), and Immigrants from Pakistan (4.8%, a difference of 0.15%).
| Demographics | Rating | Rank | Unemployment Among Ages 60 to 64 years |
| Immigrants | Africa | 86.6 /100 | #139 | Excellent 4.8% |
| Pima | 85.8 /100 | #140 | Excellent 4.8% |
| Panamanians | 85.5 /100 | #141 | Excellent 4.8% |
| Immigrants | Ethiopia | 85.3 /100 | #142 | Excellent 4.8% |
| Italians | 85.0 /100 | #143 | Excellent 4.8% |
| Immigrants | Pakistan | 83.3 /100 | #144 | Excellent 4.8% |
| Burmese | 83.1 /100 | #145 | Excellent 4.8% |
| Turks | 81.9 /100 | #146 | Excellent 4.8% |
| Mongolians | 81.2 /100 | #147 | Excellent 4.8% |
| Latvians | 79.1 /100 | #148 | Good 4.8% |
| Arabs | 78.8 /100 | #149 | Good 4.8% |
| Immigrants | Italy | 78.7 /100 | #150 | Good 4.8% |
| Immigrants | South Africa | 78.5 /100 | #151 | Good 4.8% |
| Americans | 75.7 /100 | #152 | Good 4.8% |
| Bolivians | 75.5 /100 | #153 | Good 4.8% |
| Chileans | 72.6 /100 | #154 | Good 4.8% |
| Filipinos | 72.1 /100 | #155 | Good 4.8% |
| Immigrants | Bolivia | 69.2 /100 | #156 | Good 4.8% |
| Laotians | 66.8 /100 | #157 | Good 4.8% |
| Immigrants | Taiwan | 66.0 /100 | #158 | Good 4.8% |
| Spanish | 65.5 /100 | #159 | Good 4.8% |