Korean vs Immigrants from Lebanon Unemployment Among Ages 25 to 29 years

COMPARE

Korean
Race
Ancestry
AfghanAfricanAlaska NativeAlaskan AthabascanAlbanianAleutAlsatianAmericanApacheArabArapahoArgentineanArmenianAssyrian/Chaldean/SyriacAustralianAustrianBahamianBangladeshiBarbadianBasqueBelgianBelizeanBermudanBhutaneseBlackfeetBolivianBrazilianBritishBritish West IndianBulgarianBurmeseCajunCambodianCanadianCape VerdeanCarpatho RusynCelticCentral AmericanCentral American IndianCherokeeCheyenneChickasawChileanChineseChippewaChoctawColombianColvilleComancheCosta RicanCreeCreekCroatianCrowCubanCypriotCzechCzechoslovakianDanishDelawareDominicanDutchDutch West IndianEastern EuropeanEcuadorianEgyptianEnglishEstonianEthiopianEuropeanFijianFilipinoFinnishFrenchFrench American IndianFrench CanadianGermanGerman RussianGhanaianGreekGuamanian/ChamorroGuatemalanGuyaneseHaitianHmongHonduranHopiHoumaHungarianIcelanderIndian (Asian)IndonesianInupiatIranianIraqiIrishIroquoisIsraeliItalianJamaicanJapaneseJordanianKenyanKiowaKoreanLaotianLatvianLebaneseLiberianLithuanianLumbeeLuxembourgerMacedonianMalaysianMalteseMarshalleseMenomineeMexicanMexican American IndianMongolianMoroccanNative HawaiianNavajoNepaleseNew ZealanderNicaraguanNigerianNorthern EuropeanNorwegianOkinawanOsageOttawaPaiutePakistaniPalestinianPanamanianParaguayanPennsylvania GermanPeruvianPimaPolishPortuguesePotawatomiPuebloPuerto RicanPuget Sound SalishRomanianRussianSalvadoranSamoanScandinavianScotch-IrishScottishSeminoleSenegaleseSerbianShoshoneSierra LeoneanSiouxSlavicSlovakSloveneSomaliSouth AfricanSouth AmericanSouth American IndianSoviet UnionSpaniardSpanishSpanish AmericanSpanish American IndianSri LankanSubsaharan AfricanSudaneseSwedishSwissSyrianTaiwaneseThaiTlingit-HaidaTohono O'OdhamTonganTrinidadian and TobagonianTsimshianTurkishU.S. Virgin IslanderUgandanUkrainianUruguayanUteVenezuelanVietnameseWelshWest IndianYakamaYaquiYugoslavianYumanYup'ikZimbabwean
Immigration
NonimmigrantsImmigrantsAfghanistanAfricaAlbaniaArgentinaArmeniaAsiaAustraliaAustriaBahamasBangladeshBarbadosBelarusBelgiumBelizeBoliviaBosnia and HerzegovinaBrazilBulgariaBurma/MyanmarCabo VerdeCambodiaCameroonCanadaCaribbeanCentral AmericaChileChinaColombiaCongoCosta RicaCroatiaCubaCzechoslovakiaDenmarkDominicaDominican RepublicEastern AfricaEastern AsiaEastern EuropeEcuadorEgyptEl SalvadorEnglandEritreaEthiopiaEuropeFijiFranceGermanyGhanaGreeceGrenadaGuatemalaGuyanaHaitiHondurasHong KongHungaryIndiaIndonesiaIranIraqIrelandIsraelItalyJamaicaJapanJordanKazakhstanKenyaKoreaKuwaitLaosLatin AmericaLatviaLiberiaLithuaniaMalaysiaMexicoMicronesiaMiddle AfricaMoldovaMoroccoNepalNetherlandsNicaraguaNigeriaNorth AmericaNorth MacedoniaNorthern AfricaNorthern EuropeNorwayOceaniaPakistanPanamaPeruPhilippinesPolandPortugalRomaniaRussiaSaudi ArabiaScotlandSenegalSerbiaSierra LeoneSingaporeSomaliaSouth AfricaSouth AmericaSouth Central AsiaSouth Eastern AsiaSouthern EuropeSpainSri LankaSt. Vincent and the GrenadinesSudanSwedenSwitzerlandSyriaTaiwanThailandTrinidad and TobagoTurkeyUgandaUkraineUruguayUzbekistanVenezuelaVietnamWest IndiesWestern AfricaWestern AsiaWestern EuropeYemenZaireZimbabweAzores
Immigrants from Lebanon
Race
Ancestry
AfghanAfricanAlaska NativeAlaskan AthabascanAlbanianAleutAlsatianAmericanApacheArabArapahoArgentineanArmenianAssyrian/Chaldean/SyriacAustralianAustrianBahamianBangladeshiBarbadianBasqueBelgianBelizeanBermudanBhutaneseBlackfeetBolivianBrazilianBritishBritish West IndianBulgarianBurmeseCajunCambodianCanadianCape VerdeanCarpatho RusynCelticCentral AmericanCentral American IndianCherokeeCheyenneChickasawChileanChineseChippewaChoctawColombianColvilleComancheCosta RicanCreeCreekCroatianCrowCubanCypriotCzechCzechoslovakianDanishDelawareDominicanDutchDutch West IndianEastern EuropeanEcuadorianEgyptianEnglishEstonianEthiopianEuropeanFijianFilipinoFinnishFrenchFrench American IndianFrench CanadianGermanGerman RussianGhanaianGreekGuamanian/ChamorroGuatemalanGuyaneseHaitianHmongHonduranHopiHoumaHungarianIcelanderIndian (Asian)IndonesianInupiatIranianIraqiIrishIroquoisIsraeliItalianJamaicanJapaneseJordanianKenyanKiowaLaotianLatvianLebaneseLiberianLithuanianLumbeeLuxembourgerMacedonianMalaysianMalteseMarshalleseMenomineeMexicanMexican American IndianMongolianMoroccanNative HawaiianNavajoNepaleseNew ZealanderNicaraguanNigerianNorthern EuropeanNorwegianOkinawanOsageOttawaPaiutePakistaniPalestinianPanamanianParaguayanPennsylvania GermanPeruvianPimaPolishPortuguesePotawatomiPuebloPuerto RicanPuget Sound SalishRomanianRussianSalvadoranSamoanScandinavianScotch-IrishScottishSeminoleSenegaleseSerbianShoshoneSierra LeoneanSiouxSlavicSlovakSloveneSomaliSouth AfricanSouth AmericanSouth American IndianSoviet UnionSpaniardSpanishSpanish AmericanSpanish American IndianSri LankanSubsaharan AfricanSudaneseSwedishSwissSyrianTaiwaneseThaiTlingit-HaidaTohono O'OdhamTonganTrinidadian and TobagonianTsimshianTurkishU.S. Virgin IslanderUgandanUkrainianUruguayanUteVenezuelanVietnameseWelshWest IndianYakamaYaquiYugoslavianYumanYup'ikZimbabwean
Immigration
NonimmigrantsImmigrantsAfghanistanAfricaAlbaniaArgentinaArmeniaAsiaAustraliaAustriaBahamasBangladeshBarbadosBelarusBelgiumBelizeBoliviaBosnia and HerzegovinaBrazilBulgariaBurma/MyanmarCabo VerdeCambodiaCameroonCanadaCaribbeanCentral AmericaChileChinaColombiaCongoCosta RicaCroatiaCubaCzechoslovakiaDenmarkDominicaDominican RepublicEastern AfricaEastern AsiaEastern EuropeEcuadorEgyptEl SalvadorEnglandEritreaEthiopiaEuropeFijiFranceGermanyGhanaGreeceGrenadaGuatemalaGuyanaHaitiHondurasHong KongHungaryIndiaIndonesiaIranIraqIrelandIsraelItalyJamaicaJapanJordanKazakhstanKenyaKoreaKuwaitLaosLatin AmericaLatviaLebanonLiberiaLithuaniaMalaysiaMexicoMicronesiaMiddle AfricaMoldovaMoroccoNepalNetherlandsNicaraguaNigeriaNorth AmericaNorth MacedoniaNorthern AfricaNorthern EuropeNorwayOceaniaPakistanPanamaPeruPhilippinesPolandPortugalRomaniaRussiaSaudi ArabiaScotlandSenegalSerbiaSierra LeoneSingaporeSomaliaSouth AfricaSouth AmericaSouth Central AsiaSouth Eastern AsiaSouthern EuropeSpainSri LankaSt. Vincent and the GrenadinesSudanSwedenSwitzerlandSyriaTaiwanThailandTrinidad and TobagoTurkeyUgandaUkraineUruguayUzbekistanVenezuelaVietnamWest IndiesWestern AfricaWestern AsiaWestern EuropeYemenZaireZimbabweAzores
Unemployment Among Ages 25 to 29 years
Income
Poverty
Unemployment
Labor Participation
Family Structure
Vehicle Availability
Education Level
Disability

Unemployment Among Ages 25 to 29 years Comparison

Koreans

Immigrants from Lebanon

Fair
Exceptional
6.7%
UNEMPLOYMENT AMONG AGES 25 TO 29 YEARS
29.3/ 100
METRIC RATING
190th/ 347
METRIC RANK
6.3%
UNEMPLOYMENT AMONG AGES 25 TO 29 YEARS
97.8/ 100
METRIC RATING
65th/ 347
METRIC RANK

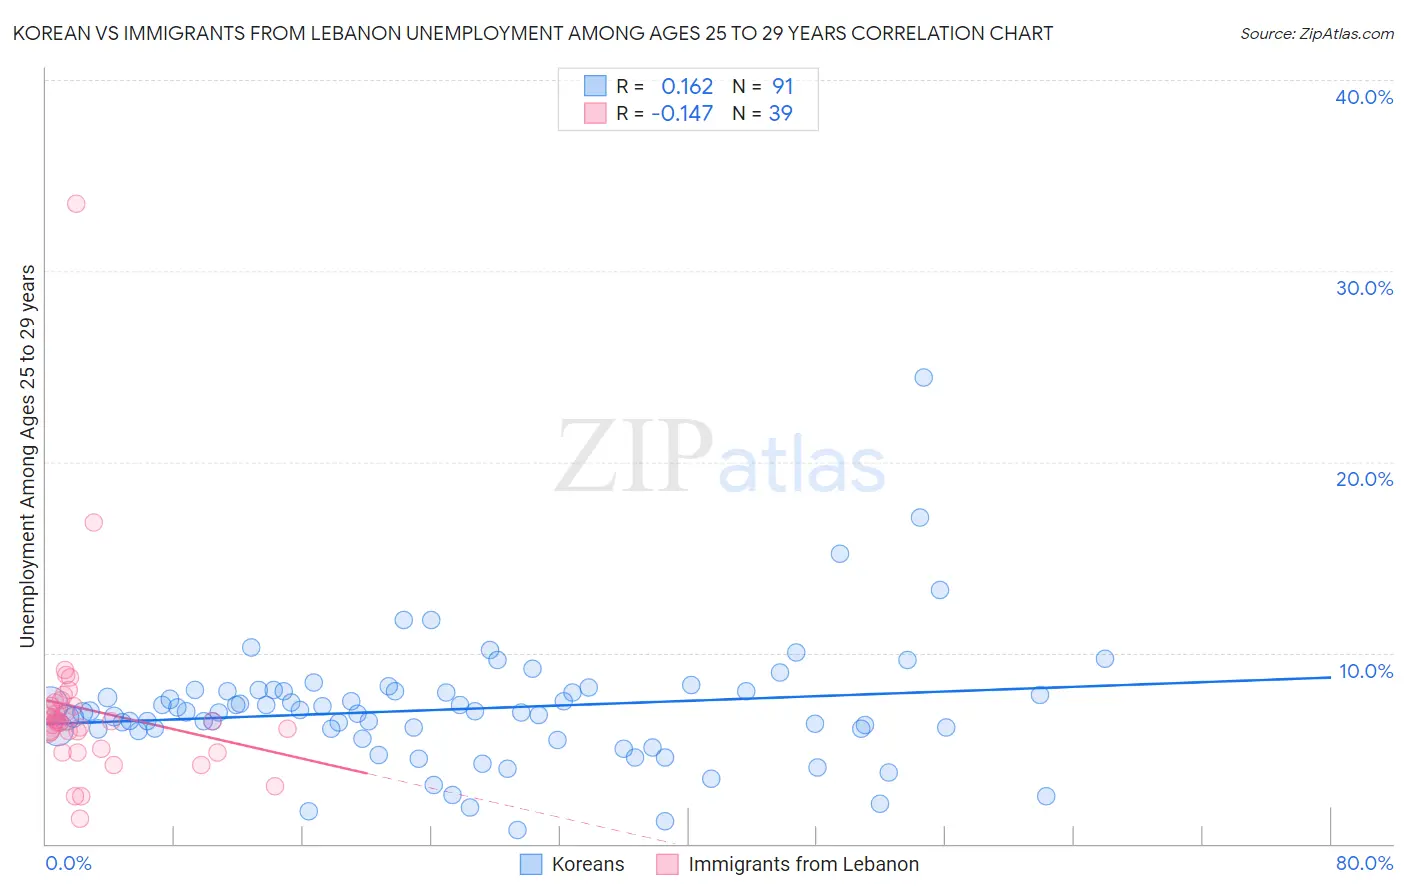
Korean vs Immigrants from Lebanon Unemployment Among Ages 25 to 29 years Correlation Chart

The statistical analysis conducted on geographies consisting of 473,026,507 people shows a poor positive correlation between the proportion of Koreans and unemployment rate among population between the ages 25 and 29 in the United States with a correlation coefficient (R) of 0.162 and weighted average of 6.7%. Similarly, the statistical analysis conducted on geographies consisting of 211,557,683 people shows a poor negative correlation between the proportion of Immigrants from Lebanon and unemployment rate among population between the ages 25 and 29 in the United States with a correlation coefficient (R) of -0.147 and weighted average of 6.3%, a difference of 7.7%.
Korean vs Immigrants from Lebanon Unemployment Among Ages 25 to 29 years

Unemployment Among Ages 25 to 29 years Correlation Summary

MeasurementKoreanImmigrants from Lebanon
Minimum0.70%1.3%
Maximum24.4%33.5%
Range23.7%32.2%
Mean7.0%7.0%
Median6.9%6.4%
Interquartile 25% (IQ1)6.0%5.0%
Interquartile 75% (IQ3)8.0%7.2%
Interquartile Range (IQR)2.0%2.2%
Standard Deviation (Sample)3.2%5.0%
Standard Deviation (Population)3.2%4.9%

Similar Demographics by Unemployment Among Ages 25 to 29 years

Demographics Similar to Koreans by Unemployment Among Ages 25 to 29 years

In terms of unemployment among ages 25 to 29 years, the demographic groups most similar to Koreans are Chickasaw (6.7%, a difference of 0.040%), Immigrants from Ukraine (6.7%, a difference of 0.050%), Alsatian (6.7%, a difference of 0.090%), Immigrants from Greece (6.7%, a difference of 0.090%), and Immigrants from Western Asia (6.7%, a difference of 0.15%).
DemographicsRating | RankUnemployment Among Ages 25 to 29 years
Immigrants | Scotland
39.6
/100
|
#183
Fair
6.7%
Immigrants | Costa Rica
38.3
/100
|
#184
Fair
6.7%
Moroccans
35.9
/100
|
#185
Fair
6.7%
Immigrants | Iran
34.4
/100
|
#186
Fair
6.7%
Immigrants | South America
33.0
/100
|
#187
Fair
6.7%
Irish
32.8
/100
|
#188
Fair
6.7%
Argentineans
32.1
/100
|
#189
Fair
6.7%
Koreans
29.3
/100
|
#190
Fair
6.7%
Chickasaw
28.7
/100
|
#191
Fair
6.7%
Immigrants | Ukraine
28.6
/100
|
#192
Fair
6.7%
Alsatians
28.1
/100
|
#193
Fair
6.7%
Immigrants | Greece
28.0
/100
|
#194
Fair
6.7%
Immigrants | Western Asia
27.3
/100
|
#195
Fair
6.7%
Hungarians
26.8
/100
|
#196
Fair
6.8%
Italians
26.5
/100
|
#197
Fair
6.8%

Demographics Similar to Immigrants from Lebanon by Unemployment Among Ages 25 to 29 years

In terms of unemployment among ages 25 to 29 years, the demographic groups most similar to Immigrants from Lebanon are Indian (Asian) (6.3%, a difference of 0.020%), Immigrants from Northern Africa (6.3%, a difference of 0.030%), Immigrants from Sri Lanka (6.3%, a difference of 0.060%), Palestinian (6.3%, a difference of 0.070%), and Kenyan (6.3%, a difference of 0.10%).
DemographicsRating | RankUnemployment Among Ages 25 to 29 years
Immigrants | Eastern Asia
98.4
/100
|
#58
Exceptional
6.2%
Luxembourgers
98.3
/100
|
#59
Exceptional
6.2%
Immigrants | Taiwan
98.3
/100
|
#60
Exceptional
6.2%
Bhutanese
98.2
/100
|
#61
Exceptional
6.2%
Immigrants | China
98.1
/100
|
#62
Exceptional
6.2%
Kenyans
98.0
/100
|
#63
Exceptional
6.3%
Immigrants | Sri Lanka
97.9
/100
|
#64
Exceptional
6.3%
Immigrants | Lebanon
97.8
/100
|
#65
Exceptional
6.3%
Indians (Asian)
97.8
/100
|
#66
Exceptional
6.3%
Immigrants | Northern Africa
97.8
/100
|
#67
Exceptional
6.3%
Palestinians
97.7
/100
|
#68
Exceptional
6.3%
Immigrants | Hong Kong
97.5
/100
|
#69
Exceptional
6.3%
Immigrants | Malaysia
97.5
/100
|
#70
Exceptional
6.3%
Immigrants | France
97.4
/100
|
#71
Exceptional
6.3%
Scandinavians
97.4
/100
|
#72
Exceptional
6.3%