Kiowa vs Immigrants from Albania Unemployment Among Ages 45 to 54 years

COMPARE

Kiowa
Race
Ancestry
AfghanAfricanAlaska NativeAlaskan AthabascanAlbanianAleutAlsatianAmericanApacheArabArapahoArgentineanArmenianAssyrian/Chaldean/SyriacAustralianAustrianBahamianBangladeshiBarbadianBasqueBelgianBelizeanBermudanBhutaneseBlackfeetBolivianBrazilianBritishBritish West IndianBulgarianBurmeseCajunCambodianCanadianCape VerdeanCarpatho RusynCelticCentral AmericanCentral American IndianCherokeeCheyenneChickasawChileanChineseChippewaChoctawColombianColvilleComancheCosta RicanCreeCreekCroatianCrowCubanCypriotCzechCzechoslovakianDanishDelawareDominicanDutchDutch West IndianEastern EuropeanEcuadorianEgyptianEnglishEstonianEthiopianEuropeanFijianFilipinoFinnishFrenchFrench American IndianFrench CanadianGermanGerman RussianGhanaianGreekGuamanian/ChamorroGuatemalanGuyaneseHaitianHmongHonduranHopiHoumaHungarianIcelanderIndian (Asian)IndonesianInupiatIranianIraqiIrishIroquoisIsraeliItalianJamaicanJapaneseJordanianKenyanKiowaKoreanLaotianLatvianLebaneseLiberianLithuanianLumbeeLuxembourgerMacedonianMalaysianMalteseMarshalleseMenomineeMexicanMexican American IndianMongolianMoroccanNative HawaiianNavajoNepaleseNew ZealanderNicaraguanNigerianNorthern EuropeanNorwegianOkinawanOsageOttawaPaiutePakistaniPalestinianPanamanianParaguayanPennsylvania GermanPeruvianPimaPolishPortuguesePotawatomiPuebloPuerto RicanPuget Sound SalishRomanianRussianSalvadoranSamoanScandinavianScotch-IrishScottishSeminoleSenegaleseSerbianShoshoneSierra LeoneanSiouxSlavicSlovakSloveneSomaliSouth AfricanSouth AmericanSouth American IndianSoviet UnionSpaniardSpanishSpanish AmericanSpanish American IndianSri LankanSubsaharan AfricanSudaneseSwedishSwissSyrianTaiwaneseThaiTlingit-HaidaTohono O'OdhamTonganTrinidadian and TobagonianTsimshianTurkishU.S. Virgin IslanderUgandanUkrainianUruguayanUteVenezuelanVietnameseWelshWest IndianYakamaYaquiYugoslavianYumanYup'ikZimbabwean
Immigration
NonimmigrantsImmigrantsAfghanistanAfricaArgentinaArmeniaAsiaAustraliaAustriaBahamasBangladeshBarbadosBelarusBelgiumBelizeBoliviaBosnia and HerzegovinaBrazilBulgariaBurma/MyanmarCabo VerdeCambodiaCameroonCanadaCaribbeanCentral AmericaChileChinaColombiaCongoCosta RicaCroatiaCubaCzechoslovakiaDenmarkDominicaDominican RepublicEastern AfricaEastern AsiaEastern EuropeEcuadorEgyptEl SalvadorEnglandEritreaEthiopiaEuropeFijiFranceGermanyGhanaGreeceGrenadaGuatemalaGuyanaHaitiHondurasHong KongHungaryIndiaIndonesiaIranIraqIrelandIsraelItalyJamaicaJapanJordanKazakhstanKenyaKoreaKuwaitLaosLatin AmericaLatviaLebanonLiberiaLithuaniaMalaysiaMexicoMicronesiaMiddle AfricaMoldovaMoroccoNepalNetherlandsNicaraguaNigeriaNorth AmericaNorth MacedoniaNorthern AfricaNorthern EuropeNorwayOceaniaPakistanPanamaPeruPhilippinesPolandPortugalRomaniaRussiaSaudi ArabiaScotlandSenegalSerbiaSierra LeoneSingaporeSomaliaSouth AfricaSouth AmericaSouth Central AsiaSouth Eastern AsiaSouthern EuropeSpainSri LankaSt. Vincent and the GrenadinesSudanSwedenSwitzerlandSyriaTaiwanThailandTrinidad and TobagoTurkeyUgandaUkraineUruguayUzbekistanVenezuelaVietnamWest IndiesWestern AfricaWestern AsiaWestern EuropeYemenZaireZimbabweAzores
Immigrants from Albania
Race
Ancestry
AfghanAfricanAlaska NativeAlaskan AthabascanAlbanianAleutAlsatianAmericanApacheArabArapahoArgentineanArmenianAssyrian/Chaldean/SyriacAustralianAustrianBahamianBangladeshiBarbadianBasqueBelgianBelizeanBermudanBhutaneseBlackfeetBolivianBrazilianBritishBritish West IndianBulgarianBurmeseCajunCambodianCanadianCape VerdeanCarpatho RusynCelticCentral AmericanCentral American IndianCherokeeCheyenneChickasawChileanChineseChippewaChoctawColombianColvilleComancheCosta RicanCreeCreekCroatianCrowCubanCypriotCzechCzechoslovakianDanishDelawareDominicanDutchDutch West IndianEastern EuropeanEcuadorianEgyptianEnglishEstonianEthiopianEuropeanFijianFilipinoFinnishFrenchFrench American IndianFrench CanadianGermanGerman RussianGhanaianGreekGuamanian/ChamorroGuatemalanGuyaneseHaitianHmongHonduranHopiHoumaHungarianIcelanderIndian (Asian)IndonesianInupiatIranianIraqiIrishIroquoisIsraeliItalianJamaicanJapaneseJordanianKenyanKoreanLaotianLatvianLebaneseLiberianLithuanianLumbeeLuxembourgerMacedonianMalaysianMalteseMarshalleseMenomineeMexicanMexican American IndianMongolianMoroccanNative HawaiianNavajoNepaleseNew ZealanderNicaraguanNigerianNorthern EuropeanNorwegianOkinawanOsageOttawaPaiutePakistaniPalestinianPanamanianParaguayanPennsylvania GermanPeruvianPimaPolishPortuguesePotawatomiPuebloPuerto RicanPuget Sound SalishRomanianRussianSalvadoranSamoanScandinavianScotch-IrishScottishSeminoleSenegaleseSerbianShoshoneSierra LeoneanSiouxSlavicSlovakSloveneSomaliSouth AfricanSouth AmericanSouth American IndianSoviet UnionSpaniardSpanishSpanish AmericanSpanish American IndianSri LankanSubsaharan AfricanSudaneseSwedishSwissSyrianTaiwaneseThaiTlingit-HaidaTohono O'OdhamTonganTrinidadian and TobagonianTsimshianTurkishU.S. Virgin IslanderUgandanUkrainianUruguayanUteVenezuelanVietnameseWelshWest IndianYakamaYaquiYugoslavianYumanYup'ikZimbabwean
Immigration
NonimmigrantsImmigrantsAfghanistanAfricaAlbaniaArgentinaArmeniaAsiaAustraliaAustriaBahamasBangladeshBarbadosBelarusBelgiumBelizeBoliviaBosnia and HerzegovinaBrazilBulgariaBurma/MyanmarCabo VerdeCambodiaCameroonCanadaCaribbeanCentral AmericaChileChinaColombiaCongoCosta RicaCroatiaCubaCzechoslovakiaDenmarkDominicaDominican RepublicEastern AfricaEastern AsiaEastern EuropeEcuadorEgyptEl SalvadorEnglandEritreaEthiopiaEuropeFijiFranceGermanyGhanaGreeceGrenadaGuatemalaGuyanaHaitiHondurasHong KongHungaryIndiaIndonesiaIranIraqIrelandIsraelItalyJamaicaJapanJordanKazakhstanKenyaKoreaKuwaitLaosLatin AmericaLatviaLebanonLiberiaLithuaniaMalaysiaMexicoMicronesiaMiddle AfricaMoldovaMoroccoNepalNetherlandsNicaraguaNigeriaNorth AmericaNorth MacedoniaNorthern AfricaNorthern EuropeNorwayOceaniaPakistanPanamaPeruPhilippinesPolandPortugalRomaniaRussiaSaudi ArabiaScotlandSenegalSerbiaSierra LeoneSingaporeSomaliaSouth AfricaSouth AmericaSouth Central AsiaSouth Eastern AsiaSouthern EuropeSpainSri LankaSt. Vincent and the GrenadinesSudanSwedenSwitzerlandSyriaTaiwanThailandTrinidad and TobagoTurkeyUgandaUkraineUruguayUzbekistanVenezuelaVietnamWest IndiesWestern AfricaWestern AsiaWestern EuropeYemenZaireZimbabweAzores
Unemployment Among Ages 45 to 54 years
Income
Poverty
Unemployment
Labor Participation
Family Structure
Vehicle Availability
Education Level
Disability

Unemployment Among Ages 45 to 54 years Comparison

Kiowa

Immigrants from Albania

Tragic
Tragic
5.1%
UNEMPLOYMENT AMONG AGES 45 TO 54 YEARS
0.0/ 100
METRIC RATING
284th/ 347
METRIC RANK
4.8%
UNEMPLOYMENT AMONG AGES 45 TO 54 YEARS
0.9/ 100
METRIC RATING
245th/ 347
METRIC RANK

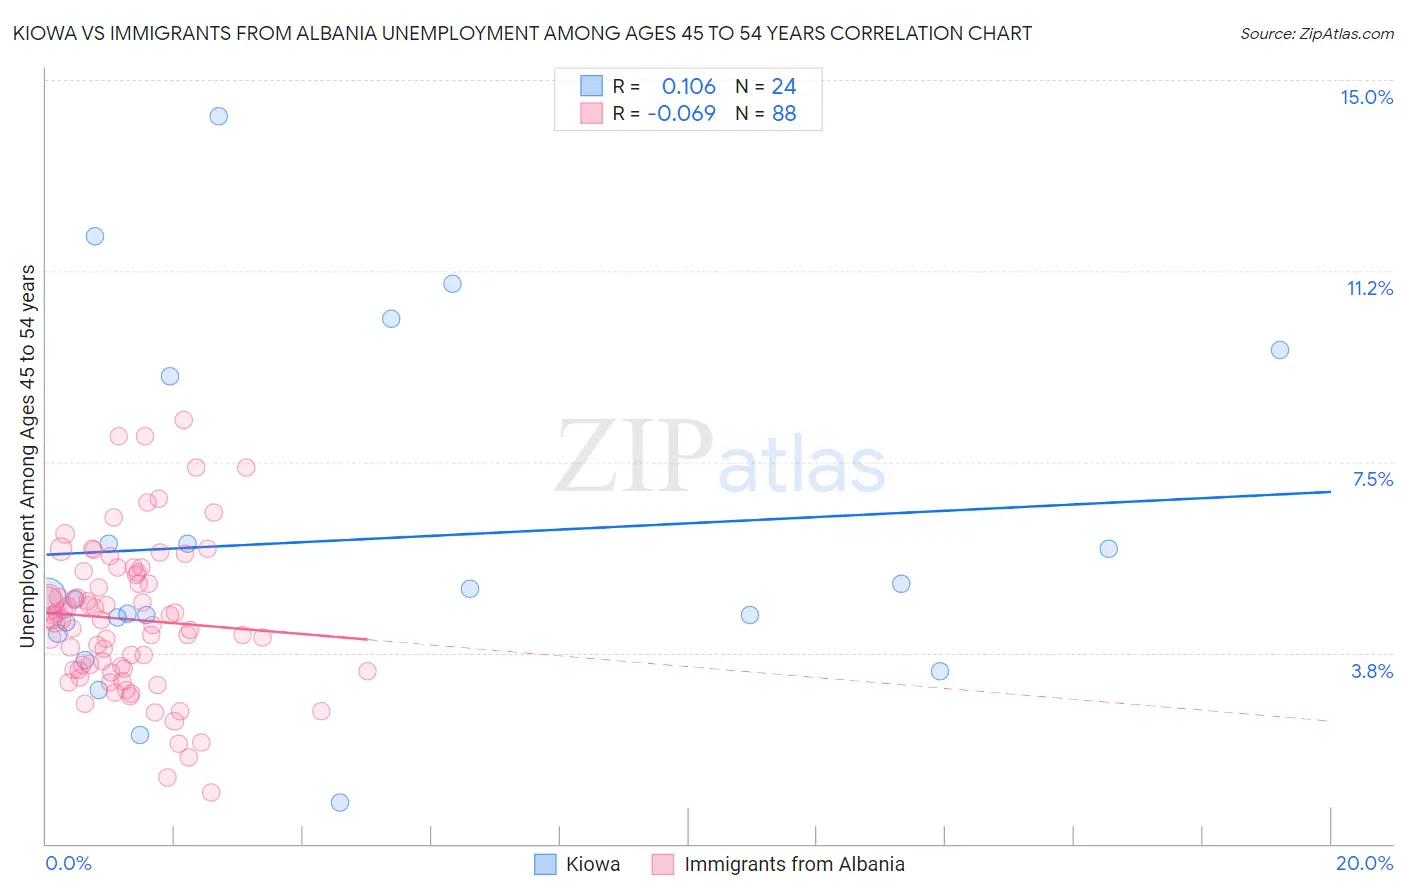
Kiowa vs Immigrants from Albania Unemployment Among Ages 45 to 54 years Correlation Chart

The statistical analysis conducted on geographies consisting of 55,688,709 people shows a poor positive correlation between the proportion of Kiowa and unemployment rate among population between the ages 45 and 54 in the United States with a correlation coefficient (R) of 0.106 and weighted average of 5.1%. Similarly, the statistical analysis conducted on geographies consisting of 118,397,124 people shows a slight negative correlation between the proportion of Immigrants from Albania and unemployment rate among population between the ages 45 and 54 in the United States with a correlation coefficient (R) of -0.069 and weighted average of 4.8%, a difference of 7.4%.
Kiowa vs Immigrants from Albania Unemployment Among Ages 45 to 54 years

Unemployment Among Ages 45 to 54 years Correlation Summary

MeasurementKiowaImmigrants from Albania
Minimum0.80%1.0%
Maximum14.3%8.3%
Range13.5%7.3%
Mean6.0%4.4%
Median4.8%4.4%
Interquartile 25% (IQ1)4.2%3.4%
Interquartile 75% (IQ3)7.5%5.3%
Interquartile Range (IQR)3.3%1.9%
Standard Deviation (Sample)3.3%1.5%
Standard Deviation (Population)3.3%1.5%

Similar Demographics by Unemployment Among Ages 45 to 54 years

Demographics Similar to Kiowa by Unemployment Among Ages 45 to 54 years

In terms of unemployment among ages 45 to 54 years, the demographic groups most similar to Kiowa are Iroquois (5.1%, a difference of 0.020%), Senegalese (5.1%, a difference of 0.18%), Hispanic or Latino (5.1%, a difference of 0.65%), Haitian (5.2%, a difference of 1.0%), and African (5.1%, a difference of 1.1%).
DemographicsRating | RankUnemployment Among Ages 45 to 54 years
Immigrants | Mexico
0.0
/100
|
#277
Tragic
5.0%
Dutch West Indians
0.0
/100
|
#278
Tragic
5.0%
Nepalese
0.0
/100
|
#279
Tragic
5.0%
Blackfeet
0.0
/100
|
#280
Tragic
5.1%
Spanish American Indians
0.0
/100
|
#281
Tragic
5.1%
Africans
0.0
/100
|
#282
Tragic
5.1%
Hispanics or Latinos
0.0
/100
|
#283
Tragic
5.1%
Kiowa
0.0
/100
|
#284
Tragic
5.1%
Iroquois
0.0
/100
|
#285
Tragic
5.1%
Senegalese
0.0
/100
|
#286
Tragic
5.1%
Haitians
0.0
/100
|
#287
Tragic
5.2%
Immigrants | Caribbean
0.0
/100
|
#288
Tragic
5.2%
Immigrants | Haiti
0.0
/100
|
#289
Tragic
5.2%
Immigrants | Portugal
0.0
/100
|
#290
Tragic
5.2%
Armenians
0.0
/100
|
#291
Tragic
5.2%

Demographics Similar to Immigrants from Albania by Unemployment Among Ages 45 to 54 years

In terms of unemployment among ages 45 to 54 years, the demographic groups most similar to Immigrants from Albania are Immigrants from Syria (4.8%, a difference of 0.010%), Israeli (4.8%, a difference of 0.060%), Seminole (4.8%, a difference of 0.15%), Immigrants from Liberia (4.8%, a difference of 0.17%), and Portuguese (4.8%, a difference of 0.21%).
DemographicsRating | RankUnemployment Among Ages 45 to 54 years
Yaqui
1.4
/100
|
#238
Tragic
4.7%
Spanish Americans
1.4
/100
|
#239
Tragic
4.7%
Immigrants | Iraq
1.3
/100
|
#240
Tragic
4.7%
Delaware
1.3
/100
|
#241
Tragic
4.8%
Central Americans
1.3
/100
|
#242
Tragic
4.8%
Portuguese
1.1
/100
|
#243
Tragic
4.8%
Seminole
1.1
/100
|
#244
Tragic
4.8%
Immigrants | Albania
0.9
/100
|
#245
Tragic
4.8%
Immigrants | Syria
0.9
/100
|
#246
Tragic
4.8%
Israelis
0.9
/100
|
#247
Tragic
4.8%
Immigrants | Liberia
0.8
/100
|
#248
Tragic
4.8%
Immigrants | Honduras
0.7
/100
|
#249
Tragic
4.8%
Salvadorans
0.7
/100
|
#250
Tragic
4.8%
Hondurans
0.4
/100
|
#251
Tragic
4.8%
Immigrants | Bahamas
0.3
/100
|
#252
Tragic
4.8%