Kenyan vs Indian (Asian) Unemployment Among Ages 55 to 59 years
COMPARE
Kenyan
Indian (Asian)
Unemployment Among Ages 55 to 59 years
Unemployment Among Ages 55 to 59 years Comparison
Kenyans
Indians (Asian)
4.4%
UNEMPLOYMENT AMONG AGES 55 TO 59 YEARS
100.0/ 100
METRIC RATING
23rd/ 347
METRIC RANK
4.9%
UNEMPLOYMENT AMONG AGES 55 TO 59 YEARS
7.6/ 100
METRIC RATING
220th/ 347
METRIC RANK
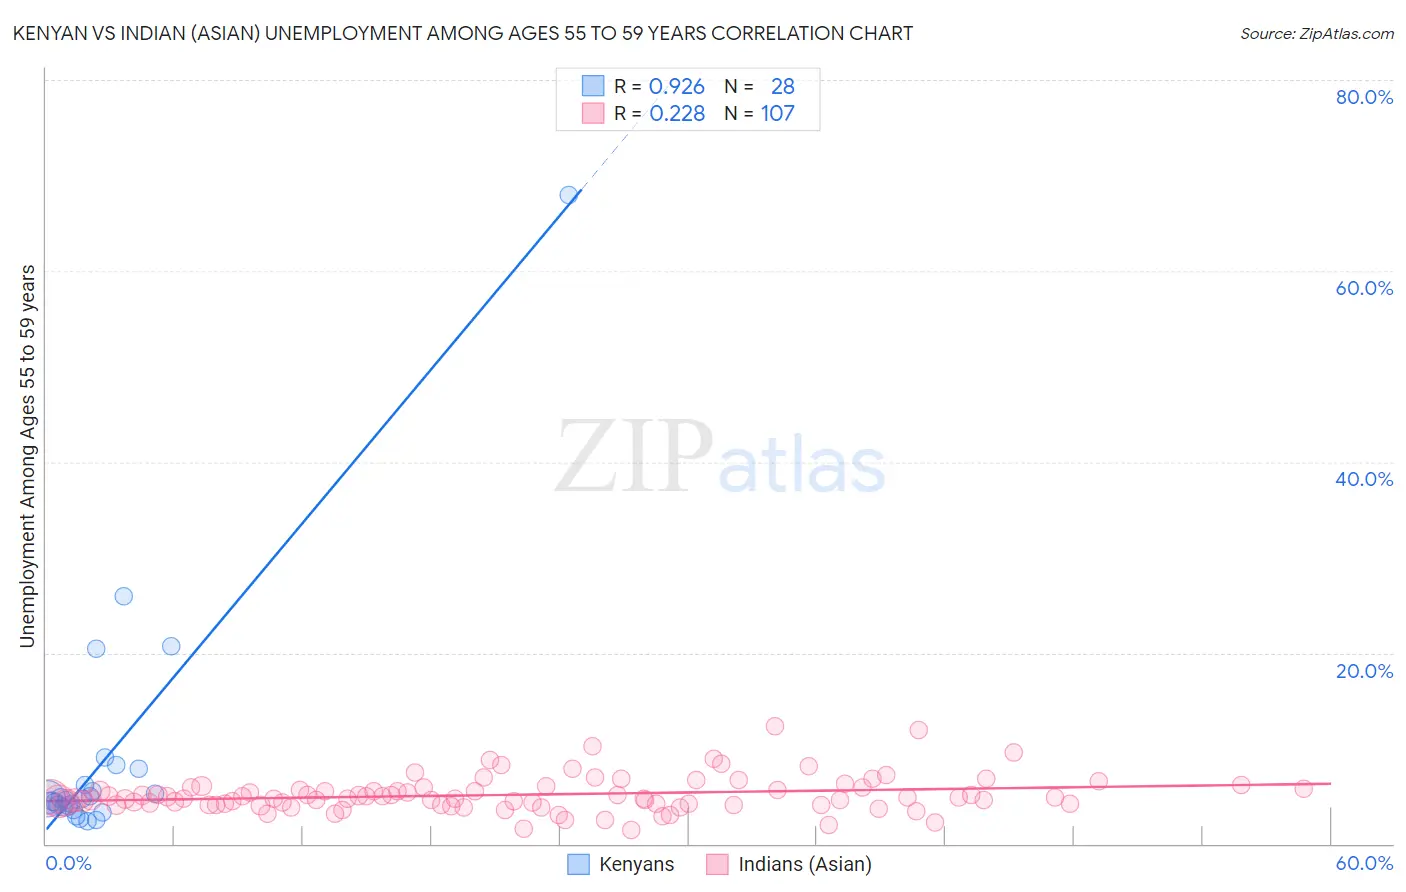
Kenyan vs Indian (Asian) Unemployment Among Ages 55 to 59 years Correlation Chart
The statistical analysis conducted on geographies consisting of 163,555,444 people shows a near-perfect positive correlation between the proportion of Kenyans and unemployment rate among population between the ages 55 and 59 in the United States with a correlation coefficient (R) of 0.926 and weighted average of 4.4%. Similarly, the statistical analysis conducted on geographies consisting of 447,877,144 people shows a weak positive correlation between the proportion of Indians (Asian) and unemployment rate among population between the ages 55 and 59 in the United States with a correlation coefficient (R) of 0.228 and weighted average of 4.9%, a difference of 11.5%.
Unemployment Among Ages 55 to 59 years Correlation Summary
| Measurement | Kenyan | Indian (Asian) |
| Minimum | 2.4% | 1.4% |
| Maximum | 68.0% | 12.3% |
| Range | 65.6% | 10.9% |
| Mean | 8.8% | 5.1% |
| Median | 4.7% | 4.7% |
| Interquartile 25% (IQ1) | 3.9% | 4.1% |
| Interquartile 75% (IQ3) | 7.0% | 5.9% |
| Interquartile Range (IQR) | 3.1% | 1.8% |
| Standard Deviation (Sample) | 13.0% | 1.9% |
| Standard Deviation (Population) | 12.7% | 1.9% |
Similar Demographics by Unemployment Among Ages 55 to 59 years
Demographics Similar to Kenyans by Unemployment Among Ages 55 to 59 years
In terms of unemployment among ages 55 to 59 years, the demographic groups most similar to Kenyans are Immigrants from Burma/Myanmar (4.4%, a difference of 0.25%), Jordanian (4.4%, a difference of 0.29%), Immigrants from Eritrea (4.4%, a difference of 0.30%), Puget Sound Salish (4.4%, a difference of 0.35%), and Scandinavian (4.5%, a difference of 0.47%).
| Demographics | Rating | Rank | Unemployment Among Ages 55 to 59 years |
| Somalis | 100.0 /100 | #16 | Exceptional 4.4% |
| Czechs | 100.0 /100 | #17 | Exceptional 4.4% |
| Immigrants | Somalia | 100.0 /100 | #18 | Exceptional 4.4% |
| Chinese | 100.0 /100 | #19 | Exceptional 4.4% |
| Swedes | 100.0 /100 | #20 | Exceptional 4.4% |
| Puget Sound Salish | 100.0 /100 | #21 | Exceptional 4.4% |
| Immigrants | Burma/Myanmar | 100.0 /100 | #22 | Exceptional 4.4% |
| Kenyans | 100.0 /100 | #23 | Exceptional 4.4% |
| Jordanians | 100.0 /100 | #24 | Exceptional 4.4% |
| Immigrants | Eritrea | 100.0 /100 | #25 | Exceptional 4.4% |
| Scandinavians | 99.9 /100 | #26 | Exceptional 4.5% |
| Immigrants | Zimbabwe | 99.9 /100 | #27 | Exceptional 4.5% |
| Immigrants | Eastern Africa | 99.9 /100 | #28 | Exceptional 4.5% |
| Palestinians | 99.9 /100 | #29 | Exceptional 4.5% |
| Immigrants | Kenya | 99.9 /100 | #30 | Exceptional 4.5% |
Demographics Similar to Indians (Asian) by Unemployment Among Ages 55 to 59 years
In terms of unemployment among ages 55 to 59 years, the demographic groups most similar to Indians (Asian) are Nigerian (4.9%, a difference of 0.010%), Immigrants from Austria (4.9%, a difference of 0.060%), Immigrants from Nigeria (4.9%, a difference of 0.060%), Immigrants from Brazil (4.9%, a difference of 0.070%), and Spanish American (4.9%, a difference of 0.080%).
| Demographics | Rating | Rank | Unemployment Among Ages 55 to 59 years |
| Bermudans | 11.0 /100 | #213 | Poor 4.9% |
| Immigrants | Denmark | 10.3 /100 | #214 | Poor 4.9% |
| Syrians | 8.6 /100 | #215 | Tragic 4.9% |
| Spanish Americans | 8.1 /100 | #216 | Tragic 4.9% |
| Immigrants | Brazil | 8.1 /100 | #217 | Tragic 4.9% |
| Immigrants | Austria | 8.0 /100 | #218 | Tragic 4.9% |
| Immigrants | Nigeria | 8.0 /100 | #219 | Tragic 4.9% |
| Indians (Asian) | 7.6 /100 | #220 | Tragic 4.9% |
| Nigerians | 7.5 /100 | #221 | Tragic 4.9% |
| Spanish | 5.1 /100 | #222 | Tragic 5.0% |
| Immigrants | Ireland | 4.8 /100 | #223 | Tragic 5.0% |
| Sub-Saharan Africans | 4.4 /100 | #224 | Tragic 5.0% |
| Costa Ricans | 4.4 /100 | #225 | Tragic 5.0% |
| Immigrants | China | 4.2 /100 | #226 | Tragic 5.0% |
| Immigrants | Iran | 3.7 /100 | #227 | Tragic 5.0% |