Jordanian vs Immigrants from North America Unemployment
COMPARE
Jordanian
Immigrants from North America
Unemployment
Unemployment Comparison
Jordanians
Immigrants from North America
5.0%
UNEMPLOYMENT
96.4/ 100
METRIC RATING
89th/ 347
METRIC RANK
4.9%
UNEMPLOYMENT
98.5/ 100
METRIC RATING
69th/ 347
METRIC RANK
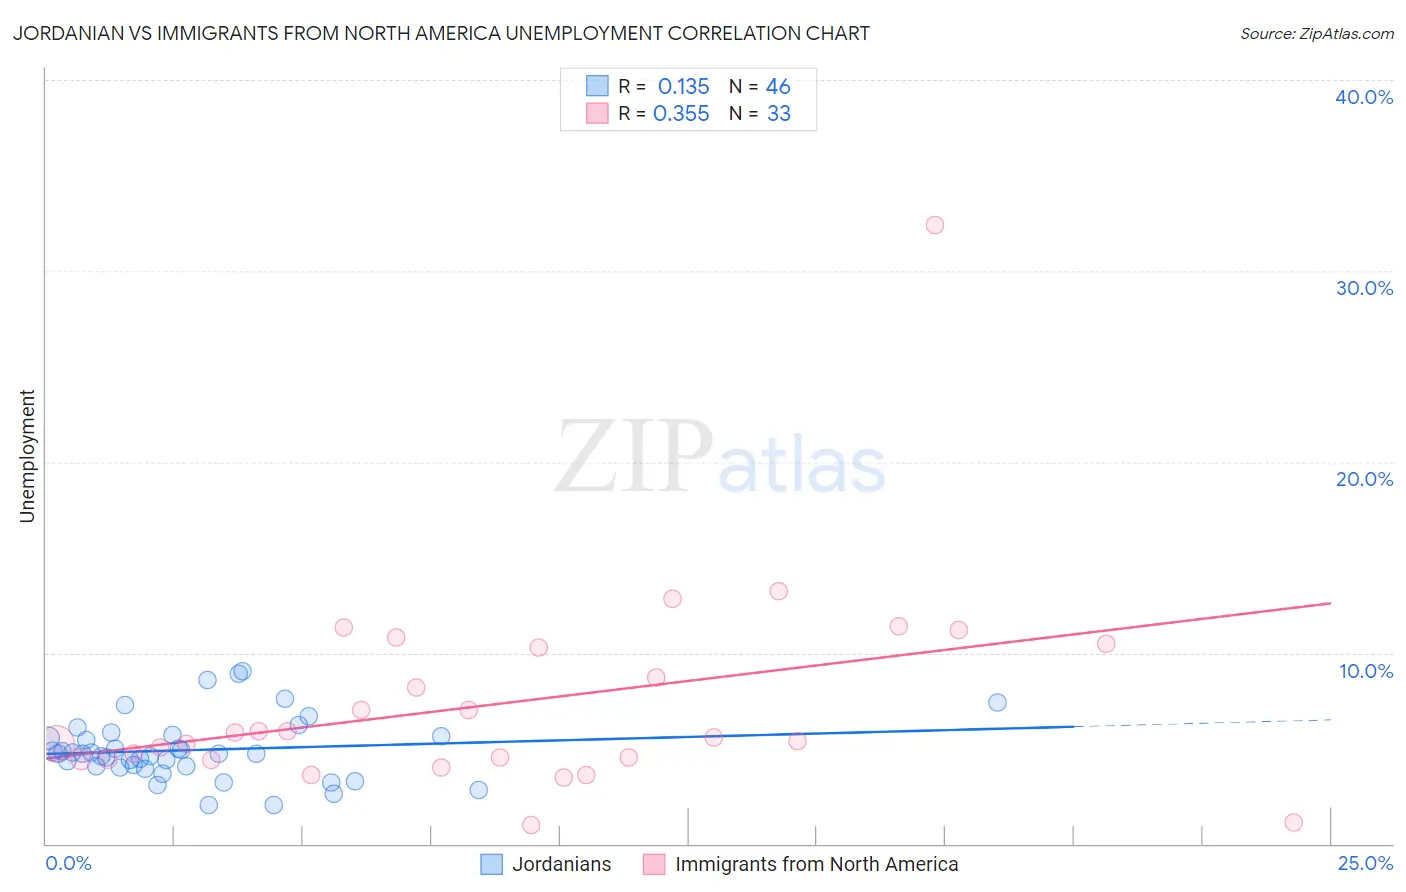
Jordanian vs Immigrants from North America Unemployment Correlation Chart
The statistical analysis conducted on geographies consisting of 166,387,098 people shows a poor positive correlation between the proportion of Jordanians and unemployment in the United States with a correlation coefficient (R) of 0.135 and weighted average of 5.0%. Similarly, the statistical analysis conducted on geographies consisting of 461,564,584 people shows a mild positive correlation between the proportion of Immigrants from North America and unemployment in the United States with a correlation coefficient (R) of 0.355 and weighted average of 4.9%, a difference of 1.5%.
Unemployment Correlation Summary
| Measurement | Jordanian | Immigrants from North America |
| Minimum | 2.0% | 1.0% |
| Maximum | 9.0% | 32.4% |
| Range | 7.0% | 31.4% |
| Mean | 4.9% | 7.4% |
| Median | 4.7% | 5.6% |
| Interquartile 25% (IQ1) | 4.1% | 4.4% |
| Interquartile 75% (IQ3) | 5.6% | 10.4% |
| Interquartile Range (IQR) | 1.5% | 5.9% |
| Standard Deviation (Sample) | 1.6% | 5.5% |
| Standard Deviation (Population) | 1.6% | 5.5% |
Demographics Similar to Jordanians and Immigrants from North America by Unemployment
In terms of unemployment, the demographic groups most similar to Jordanians are Immigrants from Korea (5.0%, a difference of 0.090%), Immigrants from Moldova (5.0%, a difference of 0.12%), Hungarian (5.0%, a difference of 0.27%), Immigrants from Australia (5.0%, a difference of 0.30%), and Russian (5.0%, a difference of 0.58%). Similarly, the demographic groups most similar to Immigrants from North America are Serbian (4.9%, a difference of 0.15%), Immigrants from Japan (4.9%, a difference of 0.21%), Burmese (4.9%, a difference of 0.23%), Paraguayan (4.9%, a difference of 0.27%), and Immigrants from Northern Europe (4.9%, a difference of 0.37%).
| Demographics | Rating | Rank | Unemployment |
| Immigrants | North America | 98.5 /100 | #69 | Exceptional 4.9% |
| Serbians | 98.4 /100 | #70 | Exceptional 4.9% |
| Immigrants | Japan | 98.3 /100 | #71 | Exceptional 4.9% |
| Burmese | 98.3 /100 | #72 | Exceptional 4.9% |
| Paraguayans | 98.3 /100 | #73 | Exceptional 4.9% |
| Immigrants | Northern Europe | 98.2 /100 | #74 | Exceptional 4.9% |
| Turks | 98.0 /100 | #75 | Exceptional 4.9% |
| German Russians | 98.0 /100 | #76 | Exceptional 4.9% |
| Cypriots | 97.9 /100 | #77 | Exceptional 4.9% |
| Okinawans | 97.9 /100 | #78 | Exceptional 4.9% |
| Canadians | 97.7 /100 | #79 | Exceptional 5.0% |
| Immigrants | Sweden | 97.6 /100 | #80 | Exceptional 5.0% |
| Basques | 97.6 /100 | #81 | Exceptional 5.0% |
| Fijians | 97.6 /100 | #82 | Exceptional 5.0% |
| Hmong | 97.6 /100 | #83 | Exceptional 5.0% |
| Russians | 97.4 /100 | #84 | Exceptional 5.0% |
| Immigrants | Australia | 97.0 /100 | #85 | Exceptional 5.0% |
| Hungarians | 96.9 /100 | #86 | Exceptional 5.0% |
| Immigrants | Moldova | 96.6 /100 | #87 | Exceptional 5.0% |
| Immigrants | Korea | 96.6 /100 | #88 | Exceptional 5.0% |
| Jordanians | 96.4 /100 | #89 | Exceptional 5.0% |