Italian vs Vietnamese Unemployment Among Ages 30 to 34 years

COMPARE

Italian
Race
Ancestry
AfghanAfricanAlaska NativeAlaskan AthabascanAlbanianAleutAlsatianAmericanApacheArabArapahoArgentineanArmenianAssyrian/Chaldean/SyriacAustralianAustrianBahamianBangladeshiBarbadianBasqueBelgianBelizeanBermudanBhutaneseBlackfeetBolivianBrazilianBritishBritish West IndianBulgarianBurmeseCajunCambodianCanadianCape VerdeanCarpatho RusynCelticCentral AmericanCentral American IndianCherokeeCheyenneChickasawChileanChineseChippewaChoctawColombianColvilleComancheCosta RicanCreeCreekCroatianCrowCubanCypriotCzechCzechoslovakianDanishDelawareDominicanDutchDutch West IndianEastern EuropeanEcuadorianEgyptianEnglishEstonianEthiopianEuropeanFijianFilipinoFinnishFrenchFrench American IndianFrench CanadianGermanGerman RussianGhanaianGreekGuamanian/ChamorroGuatemalanGuyaneseHaitianHmongHonduranHopiHoumaHungarianIcelanderIndian (Asian)IndonesianInupiatIranianIraqiIrishIroquoisIsraeliItalianJamaicanJapaneseJordanianKenyanKiowaKoreanLaotianLatvianLebaneseLiberianLithuanianLumbeeLuxembourgerMacedonianMalaysianMalteseMarshalleseMenomineeMexicanMexican American IndianMongolianMoroccanNative HawaiianNavajoNepaleseNew ZealanderNicaraguanNigerianNorthern EuropeanNorwegianOkinawanOsageOttawaPaiutePakistaniPalestinianPanamanianParaguayanPennsylvania GermanPeruvianPimaPolishPortuguesePotawatomiPuebloPuerto RicanPuget Sound SalishRomanianRussianSalvadoranSamoanScandinavianScotch-IrishScottishSeminoleSenegaleseSerbianShoshoneSierra LeoneanSiouxSlavicSlovakSloveneSomaliSouth AfricanSouth AmericanSouth American IndianSoviet UnionSpaniardSpanishSpanish AmericanSpanish American IndianSri LankanSubsaharan AfricanSudaneseSwedishSwissSyrianTaiwaneseThaiTlingit-HaidaTohono O'OdhamTonganTrinidadian and TobagonianTsimshianTurkishU.S. Virgin IslanderUgandanUkrainianUruguayanUteVenezuelanWelshWest IndianYakamaYaquiYugoslavianYumanYup'ikZimbabwean
Immigration
NonimmigrantsImmigrantsAfghanistanAfricaAlbaniaArgentinaArmeniaAsiaAustraliaAustriaBahamasBangladeshBarbadosBelarusBelgiumBelizeBoliviaBosnia and HerzegovinaBrazilBulgariaBurma/MyanmarCabo VerdeCambodiaCameroonCanadaCaribbeanCentral AmericaChileChinaColombiaCongoCosta RicaCroatiaCubaCzechoslovakiaDenmarkDominicaDominican RepublicEastern AfricaEastern AsiaEastern EuropeEcuadorEgyptEl SalvadorEnglandEritreaEthiopiaEuropeFijiFranceGermanyGhanaGreeceGrenadaGuatemalaGuyanaHaitiHondurasHong KongHungaryIndiaIndonesiaIranIraqIrelandIsraelItalyJamaicaJapanJordanKazakhstanKenyaKoreaKuwaitLaosLatin AmericaLatviaLebanonLiberiaLithuaniaMalaysiaMexicoMicronesiaMiddle AfricaMoldovaMoroccoNepalNetherlandsNicaraguaNigeriaNorth AmericaNorth MacedoniaNorthern AfricaNorthern EuropeNorwayOceaniaPakistanPanamaPeruPhilippinesPolandPortugalRomaniaRussiaSaudi ArabiaScotlandSenegalSerbiaSierra LeoneSingaporeSomaliaSouth AfricaSouth AmericaSouth Central AsiaSouth Eastern AsiaSouthern EuropeSpainSri LankaSt. Vincent and the GrenadinesSudanSwedenSwitzerlandSyriaTaiwanThailandTrinidad and TobagoTurkeyUgandaUkraineUruguayUzbekistanVenezuelaVietnamWest IndiesWestern AfricaWestern AsiaWestern EuropeYemenZaireZimbabweAzores
Vietnamese
Race
Ancestry
AfghanAfricanAlaska NativeAlaskan AthabascanAlbanianAleutAlsatianAmericanApacheArabArapahoArgentineanArmenianAssyrian/Chaldean/SyriacAustralianAustrianBahamianBangladeshiBarbadianBasqueBelgianBelizeanBermudanBhutaneseBlackfeetBolivianBrazilianBritishBritish West IndianBulgarianBurmeseCajunCambodianCanadianCape VerdeanCarpatho RusynCelticCentral AmericanCentral American IndianCherokeeCheyenneChickasawChileanChineseChippewaChoctawColombianColvilleComancheCosta RicanCreeCreekCroatianCrowCubanCypriotCzechCzechoslovakianDanishDelawareDominicanDutchDutch West IndianEastern EuropeanEcuadorianEgyptianEnglishEstonianEthiopianEuropeanFijianFilipinoFinnishFrenchFrench American IndianFrench CanadianGermanGerman RussianGhanaianGreekGuamanian/ChamorroGuatemalanGuyaneseHaitianHmongHonduranHopiHoumaHungarianIcelanderIndian (Asian)IndonesianInupiatIranianIraqiIrishIroquoisIsraeliJamaicanJapaneseJordanianKenyanKiowaKoreanLaotianLatvianLebaneseLiberianLithuanianLumbeeLuxembourgerMacedonianMalaysianMalteseMarshalleseMenomineeMexicanMexican American IndianMongolianMoroccanNative HawaiianNavajoNepaleseNew ZealanderNicaraguanNigerianNorthern EuropeanNorwegianOkinawanOsageOttawaPaiutePakistaniPalestinianPanamanianParaguayanPennsylvania GermanPeruvianPimaPolishPortuguesePotawatomiPuebloPuerto RicanPuget Sound SalishRomanianRussianSalvadoranSamoanScandinavianScotch-IrishScottishSeminoleSenegaleseSerbianShoshoneSierra LeoneanSiouxSlavicSlovakSloveneSomaliSouth AfricanSouth AmericanSouth American IndianSoviet UnionSpaniardSpanishSpanish AmericanSpanish American IndianSri LankanSubsaharan AfricanSudaneseSwedishSwissSyrianTaiwaneseThaiTlingit-HaidaTohono O'OdhamTonganTrinidadian and TobagonianTsimshianTurkishU.S. Virgin IslanderUgandanUkrainianUruguayanUteVenezuelanVietnameseWelshWest IndianYakamaYaquiYugoslavianYumanYup'ikZimbabwean
Immigration
NonimmigrantsImmigrantsAfghanistanAfricaAlbaniaArgentinaArmeniaAsiaAustraliaAustriaBahamasBangladeshBarbadosBelarusBelgiumBelizeBoliviaBosnia and HerzegovinaBrazilBulgariaBurma/MyanmarCabo VerdeCambodiaCameroonCanadaCaribbeanCentral AmericaChileChinaColombiaCongoCosta RicaCroatiaCubaCzechoslovakiaDenmarkDominicaDominican RepublicEastern AfricaEastern AsiaEastern EuropeEcuadorEgyptEl SalvadorEnglandEritreaEthiopiaEuropeFijiFranceGermanyGhanaGreeceGrenadaGuatemalaGuyanaHaitiHondurasHong KongHungaryIndiaIndonesiaIranIraqIrelandIsraelItalyJamaicaJapanJordanKazakhstanKenyaKoreaKuwaitLaosLatin AmericaLatviaLebanonLiberiaLithuaniaMalaysiaMexicoMicronesiaMiddle AfricaMoldovaMoroccoNepalNetherlandsNicaraguaNigeriaNorth AmericaNorth MacedoniaNorthern AfricaNorthern EuropeNorwayOceaniaPakistanPanamaPeruPhilippinesPolandPortugalRomaniaRussiaSaudi ArabiaScotlandSenegalSerbiaSierra LeoneSingaporeSomaliaSouth AfricaSouth AmericaSouth Central AsiaSouth Eastern AsiaSouthern EuropeSpainSri LankaSt. Vincent and the GrenadinesSudanSwedenSwitzerlandSyriaTaiwanThailandTrinidad and TobagoTurkeyUgandaUkraineUruguayUzbekistanVenezuelaVietnamWest IndiesWestern AfricaWestern AsiaWestern EuropeYemenZaireZimbabweAzores
Unemployment Among Ages 30 to 34 years
Income
Poverty
Unemployment
Labor Participation
Family Structure
Vehicle Availability
Education Level
Disability

Unemployment Among Ages 30 to 34 years Comparison

Italians

Vietnamese

Average
Tragic
5.5%
UNEMPLOYMENT AMONG AGES 30 TO 34 YEARS
45.5/ 100
METRIC RATING
180th/ 347
METRIC RANK
6.5%
UNEMPLOYMENT AMONG AGES 30 TO 34 YEARS
0.0/ 100
METRIC RATING
292nd/ 347
METRIC RANK

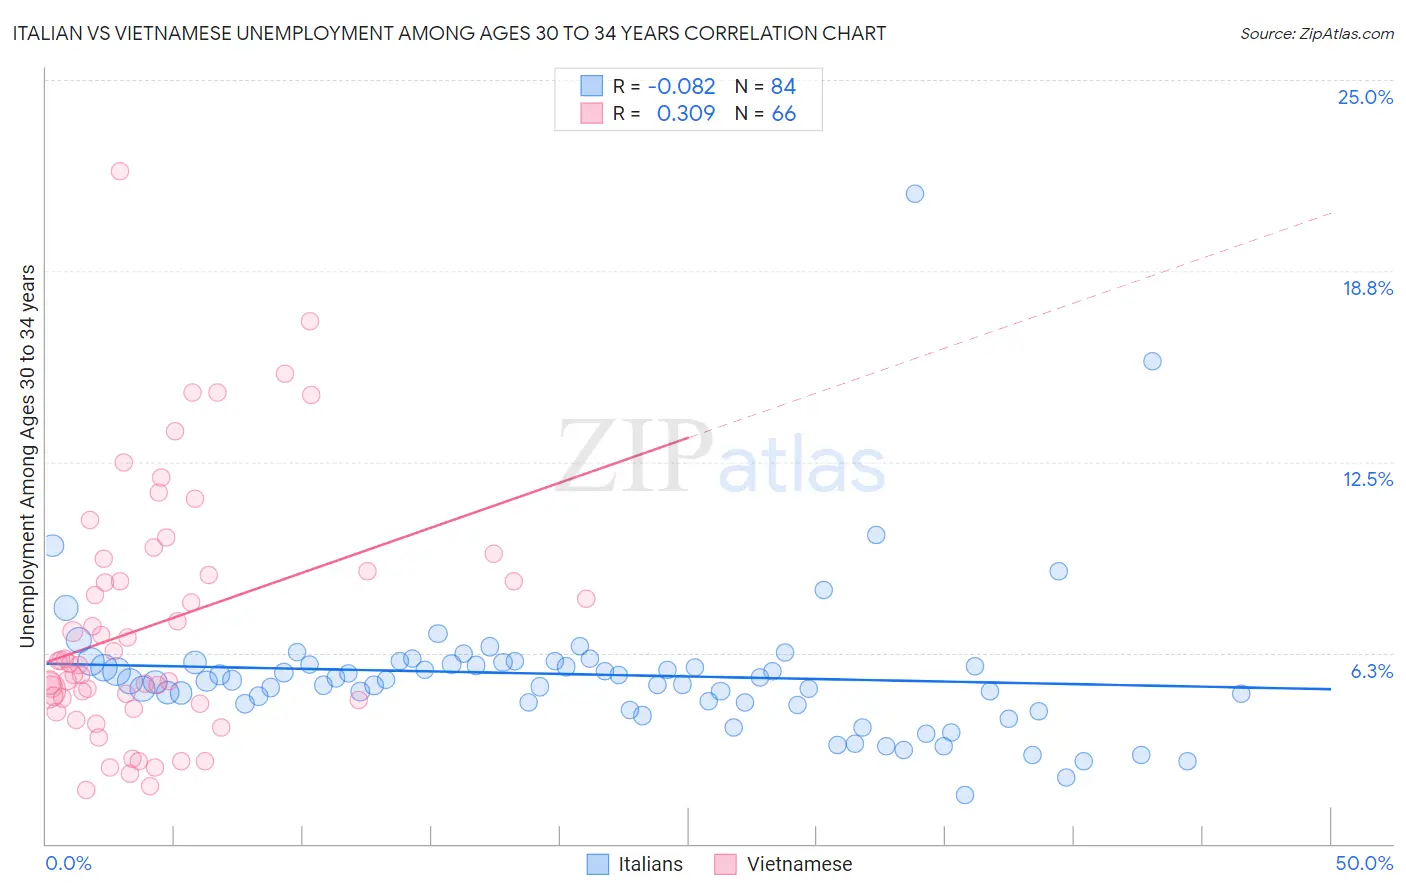
Italian vs Vietnamese Unemployment Among Ages 30 to 34 years Correlation Chart

The statistical analysis conducted on geographies consisting of 501,232,978 people shows a slight negative correlation between the proportion of Italians and unemployment rate among population between the ages 30 and 34 in the United States with a correlation coefficient (R) of -0.082 and weighted average of 5.5%. Similarly, the statistical analysis conducted on geographies consisting of 167,594,884 people shows a mild positive correlation between the proportion of Vietnamese and unemployment rate among population between the ages 30 and 34 in the United States with a correlation coefficient (R) of 0.309 and weighted average of 6.5%, a difference of 18.6%.
Italian vs Vietnamese Unemployment Among Ages 30 to 34 years

Unemployment Among Ages 30 to 34 years Correlation Summary

MeasurementItalianVietnamese
Minimum1.6%1.8%
Maximum21.3%22.0%
Range19.7%20.2%
Mean5.5%7.2%
Median5.3%5.9%
Interquartile 25% (IQ1)4.6%4.7%
Interquartile 75% (IQ3)5.9%8.9%
Interquartile Range (IQR)1.3%4.2%
Standard Deviation (Sample)2.5%4.1%
Standard Deviation (Population)2.5%4.0%

Similar Demographics by Unemployment Among Ages 30 to 34 years

Demographics Similar to Italians by Unemployment Among Ages 30 to 34 years

In terms of unemployment among ages 30 to 34 years, the demographic groups most similar to Italians are Costa Rican (5.5%, a difference of 0.090%), Macedonian (5.5%, a difference of 0.11%), Immigrants from Lebanon (5.5%, a difference of 0.14%), Immigrants from Denmark (5.5%, a difference of 0.15%), and Immigrants from Ukraine (5.5%, a difference of 0.16%).
DemographicsRating | RankUnemployment Among Ages 30 to 34 years
Peruvians
50.2
/100
|
#173
Average
5.5%
Immigrants | Laos
50.0
/100
|
#174
Average
5.5%
Afghans
49.6
/100
|
#175
Average
5.5%
Immigrants | Peru
48.0
/100
|
#176
Average
5.5%
Immigrants | Ukraine
47.7
/100
|
#177
Average
5.5%
Macedonians
47.1
/100
|
#178
Average
5.5%
Costa Ricans
46.7
/100
|
#179
Average
5.5%
Italians
45.5
/100
|
#180
Average
5.5%
Immigrants | Lebanon
43.5
/100
|
#181
Average
5.5%
Immigrants | Denmark
43.4
/100
|
#182
Average
5.5%
Hungarians
43.1
/100
|
#183
Average
5.5%
Malaysians
41.8
/100
|
#184
Average
5.5%
Immigrants | Western Europe
39.1
/100
|
#185
Fair
5.5%
Canadians
38.2
/100
|
#186
Fair
5.5%
Immigrants | Western Asia
38.2
/100
|
#187
Fair
5.5%

Demographics Similar to Vietnamese by Unemployment Among Ages 30 to 34 years

In terms of unemployment among ages 30 to 34 years, the demographic groups most similar to Vietnamese are West Indian (6.5%, a difference of 0.070%), Jamaican (6.5%, a difference of 0.27%), Barbadian (6.5%, a difference of 0.50%), Immigrants from Trinidad and Tobago (6.5%, a difference of 0.56%), and Trinidadian and Tobagonian (6.5%, a difference of 0.74%).
DemographicsRating | RankUnemployment Among Ages 30 to 34 years
Choctaw
0.0
/100
|
#285
Tragic
6.4%
Central American Indians
0.0
/100
|
#286
Tragic
6.4%
Immigrants | West Indies
0.0
/100
|
#287
Tragic
6.4%
Senegalese
0.0
/100
|
#288
Tragic
6.4%
Menominee
0.0
/100
|
#289
Tragic
6.4%
Immigrants | Trinidad and Tobago
0.0
/100
|
#290
Tragic
6.5%
Jamaicans
0.0
/100
|
#291
Tragic
6.5%
Vietnamese
0.0
/100
|
#292
Tragic
6.5%
West Indians
0.0
/100
|
#293
Tragic
6.5%
Barbadians
0.0
/100
|
#294
Tragic
6.5%
Trinidadians and Tobagonians
0.0
/100
|
#295
Tragic
6.5%
Immigrants | Jamaica
0.0
/100
|
#296
Tragic
6.5%
Creek
0.0
/100
|
#297
Tragic
6.6%
Immigrants | Barbados
0.0
/100
|
#298
Tragic
6.6%
Dutch West Indians
0.0
/100
|
#299
Tragic
6.6%