Italian vs Mexican American Indian Unemployment Among Seniors over 65 years
COMPARE
Italian
Mexican American Indian
Unemployment Among Seniors over 65 years
Unemployment Among Seniors over 65 years Comparison
Italians
Mexican American Indians
5.2%
UNEMPLOYMENT AMONG SENIORS OVER 65 YEARS
8.3/ 100
METRIC RATING
217th/ 347
METRIC RANK
5.4%
UNEMPLOYMENT AMONG SENIORS OVER 65 YEARS
0.1/ 100
METRIC RATING
275th/ 347
METRIC RANK
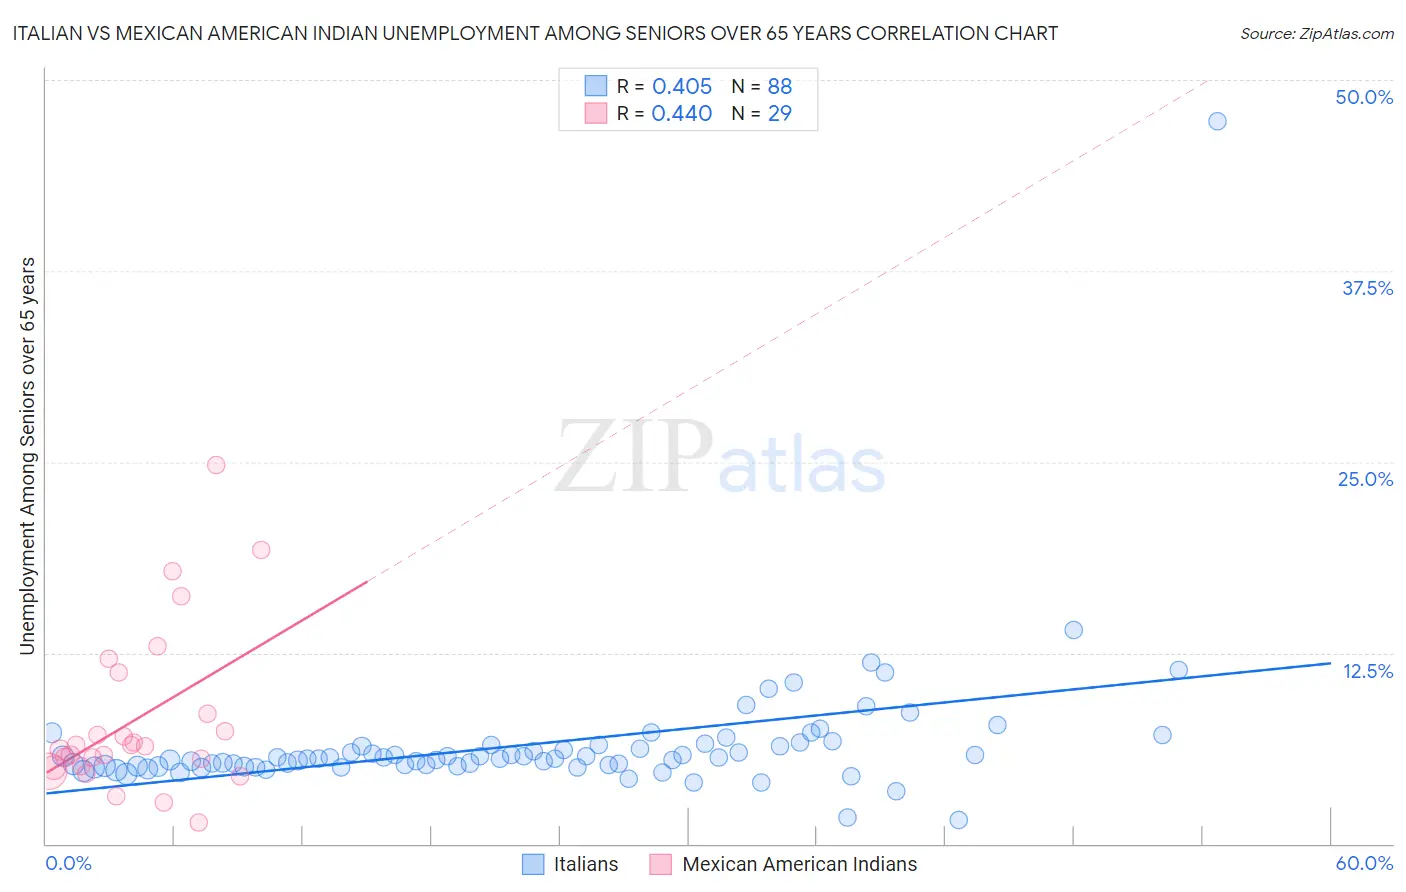
Italian vs Mexican American Indian Unemployment Among Seniors over 65 years Correlation Chart
The statistical analysis conducted on geographies consisting of 463,524,925 people shows a moderate positive correlation between the proportion of Italians and unemployment rate amomg seniors over the age of 65 in the United States with a correlation coefficient (R) of 0.405 and weighted average of 5.2%. Similarly, the statistical analysis conducted on geographies consisting of 291,158,983 people shows a moderate positive correlation between the proportion of Mexican American Indians and unemployment rate amomg seniors over the age of 65 in the United States with a correlation coefficient (R) of 0.440 and weighted average of 5.4%, a difference of 3.6%.
Unemployment Among Seniors over 65 years Correlation Summary
| Measurement | Italian | Mexican American Indian |
| Minimum | 1.5% | 1.4% |
| Maximum | 47.3% | 24.8% |
| Range | 45.8% | 23.4% |
| Mean | 6.5% | 8.1% |
| Median | 5.6% | 6.4% |
| Interquartile 25% (IQ1) | 5.1% | 5.0% |
| Interquartile 75% (IQ3) | 6.4% | 9.9% |
| Interquartile Range (IQR) | 1.4% | 4.8% |
| Standard Deviation (Sample) | 4.8% | 5.4% |
| Standard Deviation (Population) | 4.8% | 5.3% |
Similar Demographics by Unemployment Among Seniors over 65 years
Demographics Similar to Italians by Unemployment Among Seniors over 65 years
In terms of unemployment among seniors over 65 years, the demographic groups most similar to Italians are Immigrants from Fiji (5.2%, a difference of 0.030%), Cajun (5.2%, a difference of 0.030%), Albanian (5.2%, a difference of 0.080%), Immigrants from Uruguay (5.2%, a difference of 0.10%), and Spaniard (5.2%, a difference of 0.10%).
| Demographics | Rating | Rank | Unemployment Among Seniors over 65 years |
| Immigrants | Uzbekistan | 10.7 /100 | #210 | Poor 5.2% |
| Africans | 10.4 /100 | #211 | Poor 5.2% |
| Immigrants | Honduras | 10.2 /100 | #212 | Poor 5.2% |
| Immigrants | Uruguay | 9.3 /100 | #213 | Tragic 5.2% |
| Albanians | 9.1 /100 | #214 | Tragic 5.2% |
| Immigrants | Fiji | 8.6 /100 | #215 | Tragic 5.2% |
| Cajuns | 8.5 /100 | #216 | Tragic 5.2% |
| Italians | 8.3 /100 | #217 | Tragic 5.2% |
| Spaniards | 7.4 /100 | #218 | Tragic 5.2% |
| Dutch West Indians | 6.9 /100 | #219 | Tragic 5.3% |
| Egyptians | 6.4 /100 | #220 | Tragic 5.3% |
| Arapaho | 6.3 /100 | #221 | Tragic 5.3% |
| Israelis | 6.2 /100 | #222 | Tragic 5.3% |
| Cree | 5.8 /100 | #223 | Tragic 5.3% |
| Immigrants | Syria | 5.6 /100 | #224 | Tragic 5.3% |
Demographics Similar to Mexican American Indians by Unemployment Among Seniors over 65 years
In terms of unemployment among seniors over 65 years, the demographic groups most similar to Mexican American Indians are Pueblo (5.4%, a difference of 0.030%), Immigrants from Western Africa (5.4%, a difference of 0.060%), Immigrants from Brazil (5.4%, a difference of 0.13%), Immigrants from Nigeria (5.4%, a difference of 0.17%), and Colville (5.4%, a difference of 0.17%).
| Demographics | Rating | Rank | Unemployment Among Seniors over 65 years |
| Hawaiians | 0.1 /100 | #268 | Tragic 5.4% |
| Immigrants | Southern Europe | 0.1 /100 | #269 | Tragic 5.4% |
| Immigrants | Morocco | 0.1 /100 | #270 | Tragic 5.4% |
| Cypriots | 0.1 /100 | #271 | Tragic 5.4% |
| Immigrants | Jamaica | 0.1 /100 | #272 | Tragic 5.4% |
| Immigrants | Nigeria | 0.1 /100 | #273 | Tragic 5.4% |
| Immigrants | Brazil | 0.1 /100 | #274 | Tragic 5.4% |
| Mexican American Indians | 0.1 /100 | #275 | Tragic 5.4% |
| Pueblo | 0.1 /100 | #276 | Tragic 5.4% |
| Immigrants | Western Africa | 0.1 /100 | #277 | Tragic 5.4% |
| Colville | 0.1 /100 | #278 | Tragic 5.4% |
| Brazilians | 0.1 /100 | #279 | Tragic 5.5% |
| Immigrants | South America | 0.1 /100 | #280 | Tragic 5.5% |
| Immigrants | Norway | 0.0 /100 | #281 | Tragic 5.5% |
| Immigrants | Belize | 0.0 /100 | #282 | Tragic 5.5% |