Italian vs Crow Unemployment Among Ages 65 to 74 years

COMPARE

Italian
Race
Ancestry
AfghanAfricanAlaska NativeAlaskan AthabascanAlbanianAleutAlsatianAmericanApacheArabArapahoArgentineanArmenianAssyrian/Chaldean/SyriacAustralianAustrianBahamianBangladeshiBarbadianBasqueBelgianBelizeanBermudanBhutaneseBlackfeetBolivianBrazilianBritishBritish West IndianBulgarianBurmeseCajunCambodianCanadianCape VerdeanCarpatho RusynCelticCentral AmericanCentral American IndianCherokeeCheyenneChickasawChileanChineseChippewaChoctawColombianColvilleComancheCosta RicanCreeCreekCroatianCubanCypriotCzechCzechoslovakianDanishDelawareDominicanDutchDutch West IndianEastern EuropeanEcuadorianEgyptianEnglishEstonianEthiopianEuropeanFijianFilipinoFinnishFrenchFrench American IndianFrench CanadianGermanGerman RussianGhanaianGreekGuamanian/ChamorroGuatemalanGuyaneseHaitianHmongHonduranHopiHoumaHungarianIcelanderIndian (Asian)IndonesianInupiatIranianIraqiIrishIroquoisIsraeliItalianJamaicanJapaneseJordanianKenyanKiowaKoreanLaotianLatvianLebaneseLiberianLithuanianLumbeeLuxembourgerMacedonianMalaysianMalteseMarshalleseMenomineeMexicanMexican American IndianMongolianMoroccanNative HawaiianNavajoNepaleseNew ZealanderNicaraguanNigerianNorthern EuropeanNorwegianOkinawanOsageOttawaPaiutePakistaniPalestinianPanamanianParaguayanPennsylvania GermanPeruvianPimaPolishPortuguesePotawatomiPuebloPuerto RicanPuget Sound SalishRomanianRussianSalvadoranSamoanScandinavianScotch-IrishScottishSeminoleSenegaleseSerbianShoshoneSierra LeoneanSiouxSlavicSlovakSloveneSomaliSouth AfricanSouth AmericanSouth American IndianSoviet UnionSpaniardSpanishSpanish AmericanSpanish American IndianSri LankanSubsaharan AfricanSudaneseSwedishSwissSyrianTaiwaneseThaiTlingit-HaidaTohono O'OdhamTonganTrinidadian and TobagonianTsimshianTurkishU.S. Virgin IslanderUgandanUkrainianUruguayanUteVenezuelanVietnameseWelshWest IndianYakamaYaquiYugoslavianYumanYup'ikZimbabwean
Immigration
NonimmigrantsImmigrantsAfghanistanAfricaAlbaniaArgentinaArmeniaAsiaAustraliaAustriaBahamasBangladeshBarbadosBelarusBelgiumBelizeBoliviaBosnia and HerzegovinaBrazilBulgariaBurma/MyanmarCabo VerdeCambodiaCameroonCanadaCaribbeanCentral AmericaChileChinaColombiaCongoCosta RicaCroatiaCubaCzechoslovakiaDenmarkDominicaDominican RepublicEastern AfricaEastern AsiaEastern EuropeEcuadorEgyptEl SalvadorEnglandEritreaEthiopiaEuropeFijiFranceGermanyGhanaGreeceGrenadaGuatemalaGuyanaHaitiHondurasHong KongHungaryIndiaIndonesiaIranIraqIrelandIsraelItalyJamaicaJapanJordanKazakhstanKenyaKoreaKuwaitLaosLatin AmericaLatviaLebanonLiberiaLithuaniaMalaysiaMexicoMicronesiaMiddle AfricaMoldovaMoroccoNepalNetherlandsNicaraguaNigeriaNorth AmericaNorth MacedoniaNorthern AfricaNorthern EuropeNorwayOceaniaPakistanPanamaPeruPhilippinesPolandPortugalRomaniaRussiaSaudi ArabiaScotlandSenegalSerbiaSierra LeoneSingaporeSomaliaSouth AfricaSouth AmericaSouth Central AsiaSouth Eastern AsiaSouthern EuropeSpainSri LankaSt. Vincent and the GrenadinesSudanSwedenSwitzerlandSyriaTaiwanThailandTrinidad and TobagoTurkeyUgandaUkraineUruguayUzbekistanVenezuelaVietnamWest IndiesWestern AfricaWestern AsiaWestern EuropeYemenZaireZimbabweAzores
Crow
Race
Ancestry
AfghanAfricanAlaska NativeAlaskan AthabascanAlbanianAleutAlsatianAmericanApacheArabArapahoArgentineanArmenianAssyrian/Chaldean/SyriacAustralianAustrianBahamianBangladeshiBarbadianBasqueBelgianBelizeanBermudanBhutaneseBlackfeetBolivianBrazilianBritishBritish West IndianBulgarianBurmeseCajunCambodianCanadianCape VerdeanCarpatho RusynCelticCentral AmericanCentral American IndianCherokeeCheyenneChickasawChileanChineseChippewaChoctawColombianColvilleComancheCosta RicanCreeCreekCroatianCrowCubanCypriotCzechCzechoslovakianDanishDelawareDominicanDutchDutch West IndianEastern EuropeanEcuadorianEgyptianEnglishEstonianEthiopianEuropeanFijianFilipinoFinnishFrenchFrench American IndianFrench CanadianGermanGerman RussianGhanaianGreekGuamanian/ChamorroGuatemalanGuyaneseHaitianHmongHonduranHopiHoumaHungarianIcelanderIndian (Asian)IndonesianInupiatIranianIraqiIrishIroquoisIsraeliJamaicanJapaneseJordanianKenyanKiowaKoreanLaotianLatvianLebaneseLiberianLithuanianLumbeeLuxembourgerMacedonianMalaysianMalteseMarshalleseMenomineeMexicanMexican American IndianMongolianMoroccanNative HawaiianNavajoNepaleseNew ZealanderNicaraguanNigerianNorthern EuropeanNorwegianOkinawanOsageOttawaPaiutePakistaniPalestinianPanamanianParaguayanPennsylvania GermanPeruvianPimaPolishPortuguesePotawatomiPuebloPuerto RicanPuget Sound SalishRomanianRussianSalvadoranSamoanScandinavianScotch-IrishScottishSeminoleSenegaleseSerbianShoshoneSierra LeoneanSiouxSlavicSlovakSloveneSomaliSouth AfricanSouth AmericanSouth American IndianSoviet UnionSpaniardSpanishSpanish AmericanSpanish American IndianSri LankanSubsaharan AfricanSudaneseSwedishSwissSyrianTaiwaneseThaiTlingit-HaidaTohono O'OdhamTonganTrinidadian and TobagonianTsimshianTurkishU.S. Virgin IslanderUgandanUkrainianUruguayanUteVenezuelanVietnameseWelshWest IndianYakamaYaquiYugoslavianYumanYup'ikZimbabwean
Immigration
NonimmigrantsImmigrantsAfghanistanAfricaAlbaniaArgentinaArmeniaAsiaAustraliaAustriaBahamasBangladeshBarbadosBelarusBelgiumBelizeBoliviaBosnia and HerzegovinaBrazilBulgariaBurma/MyanmarCabo VerdeCambodiaCameroonCanadaCaribbeanCentral AmericaChileChinaColombiaCongoCosta RicaCroatiaCubaCzechoslovakiaDenmarkDominicaDominican RepublicEastern AfricaEastern AsiaEastern EuropeEcuadorEgyptEl SalvadorEnglandEritreaEthiopiaEuropeFijiFranceGermanyGhanaGreeceGrenadaGuatemalaGuyanaHaitiHondurasHong KongHungaryIndiaIndonesiaIranIraqIrelandIsraelItalyJamaicaJapanJordanKazakhstanKenyaKoreaKuwaitLaosLatin AmericaLatviaLebanonLiberiaLithuaniaMalaysiaMexicoMicronesiaMiddle AfricaMoldovaMoroccoNepalNetherlandsNicaraguaNigeriaNorth AmericaNorth MacedoniaNorthern AfricaNorthern EuropeNorwayOceaniaPakistanPanamaPeruPhilippinesPolandPortugalRomaniaRussiaSaudi ArabiaScotlandSenegalSerbiaSierra LeoneSingaporeSomaliaSouth AfricaSouth AmericaSouth Central AsiaSouth Eastern AsiaSouthern EuropeSpainSri LankaSt. Vincent and the GrenadinesSudanSwedenSwitzerlandSyriaTaiwanThailandTrinidad and TobagoTurkeyUgandaUkraineUruguayUzbekistanVenezuelaVietnamWest IndiesWestern AfricaWestern AsiaWestern EuropeYemenZaireZimbabweAzores
Unemployment Among Ages 65 to 74 years
Income
Poverty
Unemployment
Labor Participation
Family Structure
Vehicle Availability
Education Level
Disability

Unemployment Among Ages 65 to 74 years Comparison

Italians

Crow

Tragic
Tragic
5.5%
UNEMPLOYMENT AMONG AGES 65 TO 74 YEARS
7.7/ 100
METRIC RATING
213th/ 347
METRIC RANK
17.4%
UNEMPLOYMENT AMONG AGES 65 TO 74 YEARS
0.0/ 100
METRIC RATING
347th/ 347
METRIC RANK

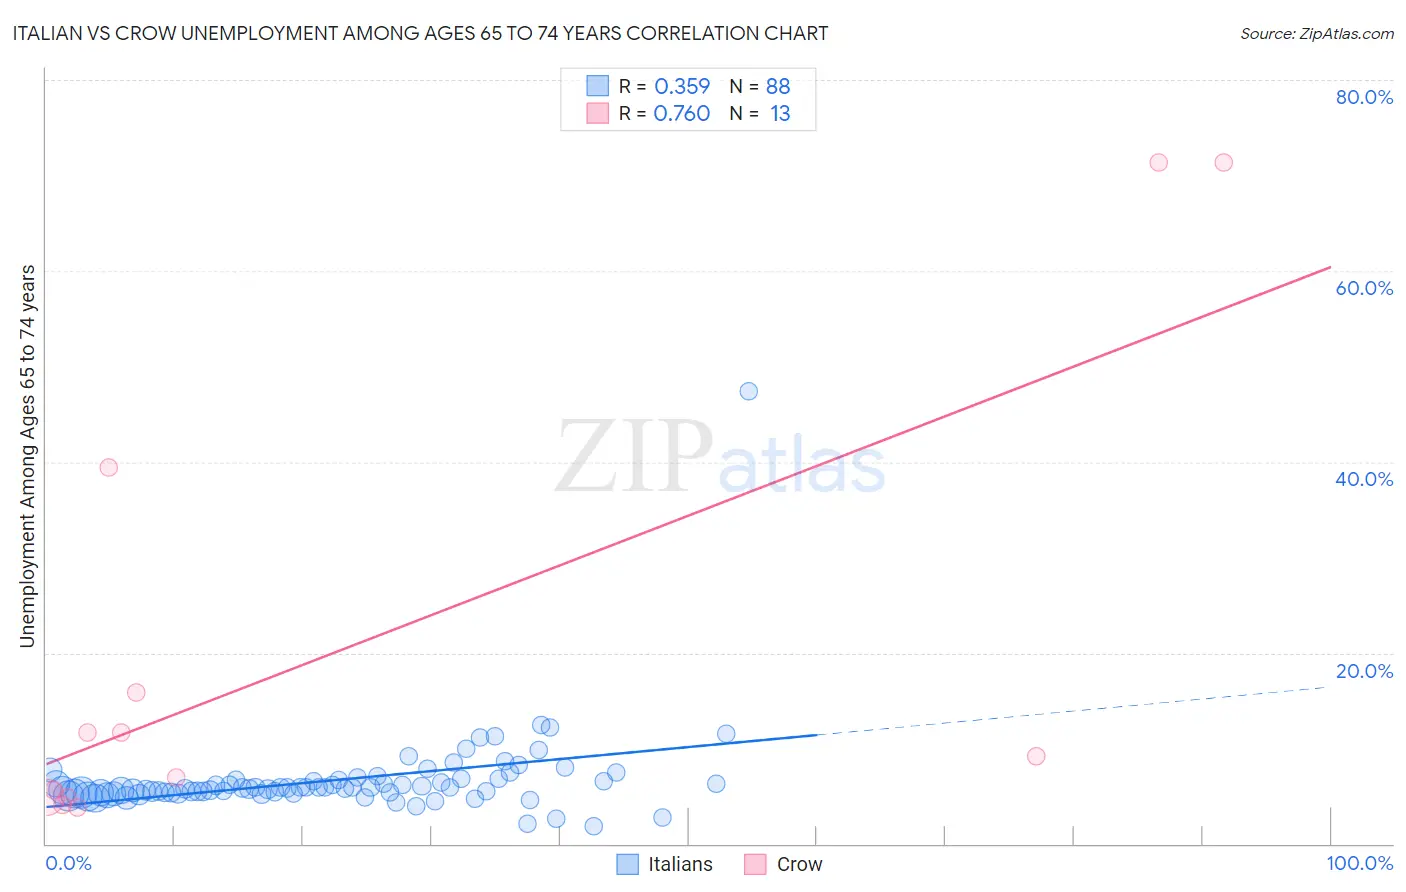
Italian vs Crow Unemployment Among Ages 65 to 74 years Correlation Chart

The statistical analysis conducted on geographies consisting of 447,314,693 people shows a mild positive correlation between the proportion of Italians and unemployment rate among population between the ages 65 and 74 in the United States with a correlation coefficient (R) of 0.359 and weighted average of 5.5%. Similarly, the statistical analysis conducted on geographies consisting of 55,742,978 people shows a strong positive correlation between the proportion of Crow and unemployment rate among population between the ages 65 and 74 in the United States with a correlation coefficient (R) of 0.760 and weighted average of 17.4%, a difference of 217.8%.
Italian vs Crow Unemployment Among Ages 65 to 74 years

Unemployment Among Ages 65 to 74 years Correlation Summary

MeasurementItalianCrow
Minimum1.9%3.9%
Maximum47.4%71.4%
Range45.5%67.5%
Mean6.7%20.0%
Median5.8%9.1%
Interquartile 25% (IQ1)5.3%4.8%
Interquartile 75% (IQ3)6.7%27.6%
Interquartile Range (IQR)1.4%22.8%
Standard Deviation (Sample)4.8%24.6%
Standard Deviation (Population)4.8%23.7%

Similar Demographics by Unemployment Among Ages 65 to 74 years

Demographics Similar to Italians by Unemployment Among Ages 65 to 74 years

In terms of unemployment among ages 65 to 74 years, the demographic groups most similar to Italians are Haitian (5.5%, a difference of 0.010%), Egyptian (5.5%, a difference of 0.010%), American (5.5%, a difference of 0.050%), Immigrants from Croatia (5.5%, a difference of 0.15%), and Uruguayan (5.5%, a difference of 0.18%).
DemographicsRating | RankUnemployment Among Ages 65 to 74 years
Africans
12.8
/100
|
#206
Poor
5.5%
Immigrants | Uzbekistan
12.5
/100
|
#207
Poor
5.5%
Dutch West Indians
11.5
/100
|
#208
Poor
5.5%
Immigrants | Honduras
10.4
/100
|
#209
Poor
5.5%
Immigrants | Northern Africa
10.1
/100
|
#210
Poor
5.5%
Immigrants | Croatia
9.1
/100
|
#211
Tragic
5.5%
Haitians
7.7
/100
|
#212
Tragic
5.5%
Italians
7.7
/100
|
#213
Tragic
5.5%
Egyptians
7.6
/100
|
#214
Tragic
5.5%
Americans
7.3
/100
|
#215
Tragic
5.5%
Uruguayans
6.2
/100
|
#216
Tragic
5.5%
Blackfeet
5.8
/100
|
#217
Tragic
5.5%
Samoans
5.7
/100
|
#218
Tragic
5.5%
Alsatians
5.6
/100
|
#219
Tragic
5.5%
Immigrants | Syria
5.1
/100
|
#220
Tragic
5.5%

Demographics Similar to Crow by Unemployment Among Ages 65 to 74 years

In terms of unemployment among ages 65 to 74 years, the demographic groups most similar to Crow are Yup'ik (9.5%, a difference of 84.0%), Immigrants from Yemen (8.3%, a difference of 110.8%), Inupiat (7.5%, a difference of 132.3%), Alaskan Athabascan (7.4%, a difference of 136.7%), and Navajo (6.9%, a difference of 151.3%).
DemographicsRating | RankUnemployment Among Ages 65 to 74 years
Paiute
0.0
/100
|
#333
Tragic
6.3%
Taiwanese
0.0
/100
|
#334
Tragic
6.3%
Puerto Ricans
0.0
/100
|
#335
Tragic
6.4%
Immigrants | Armenia
0.0
/100
|
#336
Tragic
6.5%
Ute
0.0
/100
|
#337
Tragic
6.5%
Tlingit-Haida
0.0
/100
|
#338
Tragic
6.5%
Yakama
0.0
/100
|
#339
Tragic
6.6%
Pima
0.0
/100
|
#340
Tragic
6.6%
Alaska Natives
0.0
/100
|
#341
Tragic
6.8%
Navajo
0.0
/100
|
#342
Tragic
6.9%
Alaskan Athabascans
0.0
/100
|
#343
Tragic
7.4%
Inupiat
0.0
/100
|
#344
Tragic
7.5%
Immigrants | Yemen
0.0
/100
|
#345
Tragic
8.3%
Yup'ik
0.0
/100
|
#346
Tragic
9.5%
Crow
0.0
/100
|
#347
Tragic
17.4%