Israeli vs Salvadoran Unemployment Among Ages 35 to 44 years

COMPARE

Israeli
Race
Ancestry
AfghanAfricanAlaska NativeAlaskan AthabascanAlbanianAleutAlsatianAmericanApacheArabArapahoArgentineanArmenianAssyrian/Chaldean/SyriacAustralianAustrianBahamianBangladeshiBarbadianBasqueBelgianBelizeanBermudanBhutaneseBlackfeetBolivianBrazilianBritishBritish West IndianBulgarianBurmeseCajunCambodianCanadianCape VerdeanCarpatho RusynCelticCentral AmericanCentral American IndianCherokeeCheyenneChickasawChileanChineseChippewaChoctawColombianColvilleComancheCosta RicanCreeCreekCroatianCrowCubanCypriotCzechCzechoslovakianDanishDelawareDominicanDutchDutch West IndianEastern EuropeanEcuadorianEgyptianEnglishEstonianEthiopianEuropeanFijianFilipinoFinnishFrenchFrench American IndianFrench CanadianGermanGerman RussianGhanaianGreekGuamanian/ChamorroGuatemalanGuyaneseHaitianHmongHonduranHopiHoumaHungarianIcelanderIndian (Asian)IndonesianInupiatIranianIraqiIrishIroquoisIsraeliItalianJamaicanJapaneseJordanianKenyanKiowaKoreanLaotianLatvianLebaneseLiberianLithuanianLumbeeLuxembourgerMacedonianMalaysianMalteseMarshalleseMenomineeMexicanMexican American IndianMongolianMoroccanNative HawaiianNavajoNepaleseNew ZealanderNicaraguanNigerianNorthern EuropeanNorwegianOkinawanOsageOttawaPaiutePakistaniPalestinianPanamanianParaguayanPennsylvania GermanPeruvianPimaPolishPortuguesePotawatomiPuebloPuerto RicanPuget Sound SalishRomanianRussianSamoanScandinavianScotch-IrishScottishSeminoleSenegaleseSerbianShoshoneSierra LeoneanSiouxSlavicSlovakSloveneSomaliSouth AfricanSouth AmericanSouth American IndianSoviet UnionSpaniardSpanishSpanish AmericanSpanish American IndianSri LankanSubsaharan AfricanSudaneseSwedishSwissSyrianTaiwaneseThaiTlingit-HaidaTohono O'OdhamTonganTrinidadian and TobagonianTsimshianTurkishU.S. Virgin IslanderUgandanUkrainianUruguayanUteVenezuelanVietnameseWelshWest IndianYakamaYaquiYugoslavianYumanYup'ikZimbabwean
Immigration
NonimmigrantsImmigrantsAfghanistanAfricaAlbaniaArgentinaArmeniaAsiaAustraliaAustriaBahamasBangladeshBarbadosBelarusBelgiumBelizeBoliviaBosnia and HerzegovinaBrazilBulgariaBurma/MyanmarCabo VerdeCambodiaCameroonCanadaCaribbeanCentral AmericaChileChinaColombiaCongoCosta RicaCroatiaCubaCzechoslovakiaDenmarkDominicaDominican RepublicEastern AfricaEastern AsiaEastern EuropeEcuadorEgyptEl SalvadorEnglandEritreaEthiopiaEuropeFijiFranceGermanyGhanaGreeceGrenadaGuatemalaGuyanaHaitiHondurasHong KongHungaryIndiaIndonesiaIranIraqIrelandIsraelItalyJamaicaJapanJordanKazakhstanKenyaKoreaKuwaitLaosLatin AmericaLatviaLebanonLiberiaLithuaniaMalaysiaMexicoMicronesiaMiddle AfricaMoldovaMoroccoNepalNetherlandsNicaraguaNigeriaNorth AmericaNorth MacedoniaNorthern AfricaNorthern EuropeNorwayOceaniaPakistanPanamaPeruPhilippinesPolandPortugalRomaniaRussiaSaudi ArabiaScotlandSenegalSerbiaSierra LeoneSingaporeSomaliaSouth AfricaSouth AmericaSouth Central AsiaSouth Eastern AsiaSouthern EuropeSpainSri LankaSt. Vincent and the GrenadinesSudanSwedenSwitzerlandSyriaTaiwanThailandTrinidad and TobagoTurkeyUgandaUkraineUruguayUzbekistanVenezuelaVietnamWest IndiesWestern AfricaWestern AsiaWestern EuropeYemenZaireZimbabweAzores
Salvadoran
Race
Ancestry
AfghanAfricanAlaska NativeAlaskan AthabascanAlbanianAleutAlsatianAmericanApacheArabArapahoArgentineanArmenianAssyrian/Chaldean/SyriacAustralianAustrianBahamianBangladeshiBarbadianBasqueBelgianBelizeanBermudanBhutaneseBlackfeetBolivianBrazilianBritishBritish West IndianBulgarianBurmeseCajunCambodianCanadianCape VerdeanCarpatho RusynCelticCentral AmericanCentral American IndianCherokeeCheyenneChickasawChileanChineseChippewaChoctawColombianColvilleComancheCosta RicanCreeCreekCroatianCrowCubanCypriotCzechCzechoslovakianDanishDelawareDominicanDutchDutch West IndianEastern EuropeanEcuadorianEgyptianEnglishEstonianEthiopianEuropeanFijianFilipinoFinnishFrenchFrench American IndianFrench CanadianGermanGerman RussianGhanaianGreekGuamanian/ChamorroGuatemalanGuyaneseHaitianHmongHonduranHopiHoumaHungarianIcelanderIndian (Asian)IndonesianInupiatIranianIraqiIrishIroquoisItalianJamaicanJapaneseJordanianKenyanKiowaKoreanLaotianLatvianLebaneseLiberianLithuanianLumbeeLuxembourgerMacedonianMalaysianMalteseMarshalleseMenomineeMexicanMexican American IndianMongolianMoroccanNative HawaiianNavajoNepaleseNew ZealanderNicaraguanNigerianNorthern EuropeanNorwegianOkinawanOsageOttawaPaiutePakistaniPalestinianPanamanianParaguayanPennsylvania GermanPeruvianPimaPolishPortuguesePotawatomiPuebloPuerto RicanPuget Sound SalishRomanianRussianSalvadoranSamoanScandinavianScotch-IrishScottishSeminoleSenegaleseSerbianShoshoneSierra LeoneanSiouxSlavicSlovakSloveneSomaliSouth AfricanSouth AmericanSouth American IndianSoviet UnionSpaniardSpanishSpanish AmericanSpanish American IndianSri LankanSubsaharan AfricanSudaneseSwedishSwissSyrianTaiwaneseThaiTlingit-HaidaTohono O'OdhamTonganTrinidadian and TobagonianTsimshianTurkishU.S. Virgin IslanderUgandanUkrainianUruguayanUteVenezuelanVietnameseWelshWest IndianYakamaYaquiYugoslavianYumanYup'ikZimbabwean
Immigration
NonimmigrantsImmigrantsAfghanistanAfricaAlbaniaArgentinaArmeniaAsiaAustraliaAustriaBahamasBangladeshBarbadosBelarusBelgiumBelizeBoliviaBosnia and HerzegovinaBrazilBulgariaBurma/MyanmarCabo VerdeCambodiaCameroonCanadaCaribbeanCentral AmericaChileChinaColombiaCongoCosta RicaCroatiaCubaCzechoslovakiaDenmarkDominicaDominican RepublicEastern AfricaEastern AsiaEastern EuropeEcuadorEgyptEl SalvadorEnglandEritreaEthiopiaEuropeFijiFranceGermanyGhanaGreeceGrenadaGuatemalaGuyanaHaitiHondurasHong KongHungaryIndiaIndonesiaIranIraqIrelandIsraelItalyJamaicaJapanJordanKazakhstanKenyaKoreaKuwaitLaosLatin AmericaLatviaLebanonLiberiaLithuaniaMalaysiaMexicoMicronesiaMiddle AfricaMoldovaMoroccoNepalNetherlandsNicaraguaNigeriaNorth AmericaNorth MacedoniaNorthern AfricaNorthern EuropeNorwayOceaniaPakistanPanamaPeruPhilippinesPolandPortugalRomaniaRussiaSaudi ArabiaScotlandSenegalSerbiaSierra LeoneSingaporeSomaliaSouth AfricaSouth AmericaSouth Central AsiaSouth Eastern AsiaSouthern EuropeSpainSri LankaSt. Vincent and the GrenadinesSudanSwedenSwitzerlandSyriaTaiwanThailandTrinidad and TobagoTurkeyUgandaUkraineUruguayUzbekistanVenezuelaVietnamWest IndiesWestern AfricaWestern AsiaWestern EuropeYemenZaireZimbabweAzores
Unemployment Among Ages 35 to 44 years
Income
Poverty
Unemployment
Labor Participation
Family Structure
Vehicle Availability
Education Level
Disability

Unemployment Among Ages 35 to 44 years Comparison

Israelis

Salvadorans

Fair
Tragic
4.7%
UNEMPLOYMENT AMONG AGES 35 TO 44 YEARS
38.5/ 100
METRIC RATING
182nd/ 347
METRIC RANK
5.1%
UNEMPLOYMENT AMONG AGES 35 TO 44 YEARS
0.4/ 100
METRIC RATING
243rd/ 347
METRIC RANK

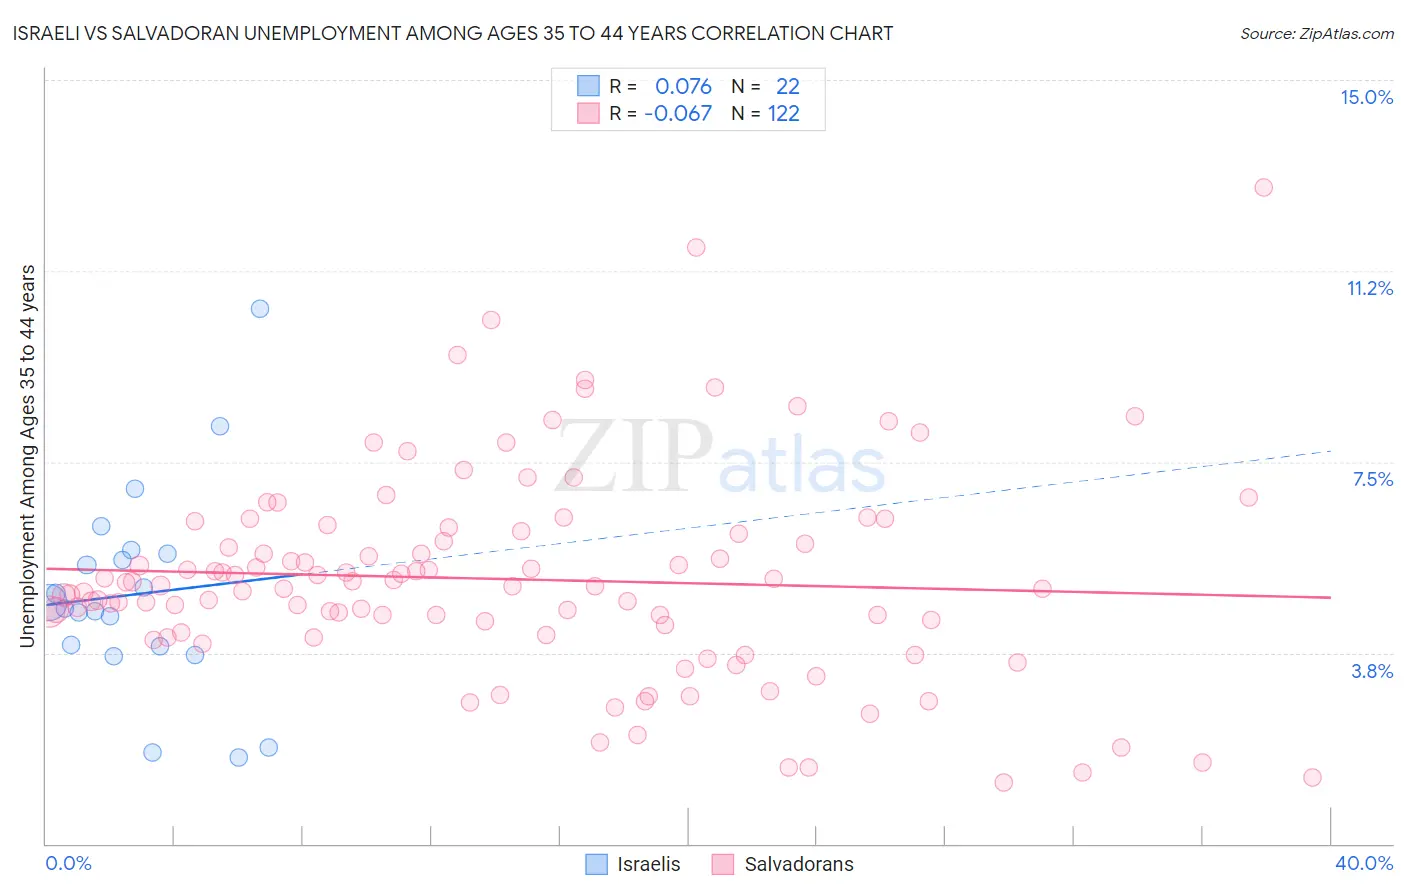
Israeli vs Salvadoran Unemployment Among Ages 35 to 44 years Correlation Chart

The statistical analysis conducted on geographies consisting of 208,796,154 people shows a slight positive correlation between the proportion of Israelis and unemployment rate among population between the ages 35 and 44 in the United States with a correlation coefficient (R) of 0.076 and weighted average of 4.7%. Similarly, the statistical analysis conducted on geographies consisting of 391,087,109 people shows a slight negative correlation between the proportion of Salvadorans and unemployment rate among population between the ages 35 and 44 in the United States with a correlation coefficient (R) of -0.067 and weighted average of 5.1%, a difference of 8.7%.
Israeli vs Salvadoran Unemployment Among Ages 35 to 44 years

Unemployment Among Ages 35 to 44 years Correlation Summary

MeasurementIsraeliSalvadoran
Minimum1.7%1.2%
Maximum10.5%12.9%
Range8.8%11.7%
Mean4.9%5.2%
Median4.7%5.1%
Interquartile 25% (IQ1)3.9%4.2%
Interquartile 75% (IQ3)5.7%6.1%
Interquartile Range (IQR)1.8%1.9%
Standard Deviation (Sample)2.0%2.0%
Standard Deviation (Population)2.0%2.0%

Similar Demographics by Unemployment Among Ages 35 to 44 years

Demographics Similar to Israelis by Unemployment Among Ages 35 to 44 years

In terms of unemployment among ages 35 to 44 years, the demographic groups most similar to Israelis are Immigrants from Poland (4.7%, a difference of 0.040%), Brazilian (4.7%, a difference of 0.080%), Immigrants from Zaire (4.7%, a difference of 0.090%), Immigrants from Peru (4.7%, a difference of 0.10%), and Immigrants from Costa Rica (4.7%, a difference of 0.11%).
DemographicsRating | RankUnemployment Among Ages 35 to 44 years
Immigrants | Germany
48.9
/100
|
#175
Average
4.7%
Immigrants | Uganda
48.1
/100
|
#176
Average
4.7%
Slovaks
44.6
/100
|
#177
Average
4.7%
South American Indians
40.7
/100
|
#178
Average
4.7%
Immigrants | South Eastern Asia
40.2
/100
|
#179
Average
4.7%
Immigrants | Peru
39.9
/100
|
#180
Fair
4.7%
Brazilians
39.5
/100
|
#181
Fair
4.7%
Israelis
38.5
/100
|
#182
Fair
4.7%
Immigrants | Poland
37.9
/100
|
#183
Fair
4.7%
Immigrants | Zaire
37.3
/100
|
#184
Fair
4.7%
Immigrants | Costa Rica
37.0
/100
|
#185
Fair
4.7%
Cypriots
36.5
/100
|
#186
Fair
4.7%
Malaysians
35.5
/100
|
#187
Fair
4.7%
Immigrants | Laos
34.5
/100
|
#188
Fair
4.7%
Immigrants | Congo
33.9
/100
|
#189
Fair
4.7%

Demographics Similar to Salvadorans by Unemployment Among Ages 35 to 44 years

In terms of unemployment among ages 35 to 44 years, the demographic groups most similar to Salvadorans are Guatemalan (5.1%, a difference of 0.0%), Delaware (5.1%, a difference of 0.12%), Bahamian (5.2%, a difference of 0.26%), Immigrants from Guatemala (5.2%, a difference of 0.26%), and Immigrants from Somalia (5.2%, a difference of 0.42%).
DemographicsRating | RankUnemployment Among Ages 35 to 44 years
Central Americans
0.8
/100
|
#236
Tragic
5.1%
Kiowa
0.8
/100
|
#237
Tragic
5.1%
Hondurans
0.7
/100
|
#238
Tragic
5.1%
Nigerians
0.7
/100
|
#239
Tragic
5.1%
Somalis
0.7
/100
|
#240
Tragic
5.1%
Immigrants | Honduras
0.6
/100
|
#241
Tragic
5.1%
Delaware
0.5
/100
|
#242
Tragic
5.1%
Salvadorans
0.4
/100
|
#243
Tragic
5.1%
Guatemalans
0.4
/100
|
#244
Tragic
5.1%
Bahamians
0.4
/100
|
#245
Tragic
5.2%
Immigrants | Guatemala
0.4
/100
|
#246
Tragic
5.2%
Immigrants | Somalia
0.3
/100
|
#247
Tragic
5.2%
Alsatians
0.2
/100
|
#248
Tragic
5.2%
Immigrants | Liberia
0.2
/100
|
#249
Tragic
5.2%
Immigrants | El Salvador
0.2
/100
|
#250
Tragic
5.2%