Israeli vs Immigrants from Caribbean Unemployment Among Seniors over 75 years

COMPARE

Israeli
Race
Ancestry
AfghanAfricanAlaska NativeAlaskan AthabascanAlbanianAleutAlsatianAmericanApacheArabArapahoArgentineanArmenianAssyrian/Chaldean/SyriacAustralianAustrianBahamianBangladeshiBarbadianBasqueBelgianBelizeanBermudanBhutaneseBlackfeetBolivianBrazilianBritishBritish West IndianBulgarianBurmeseCajunCambodianCanadianCape VerdeanCarpatho RusynCelticCentral AmericanCentral American IndianCherokeeCheyenneChickasawChileanChineseChippewaChoctawColombianColvilleComancheCosta RicanCreeCreekCroatianCrowCubanCypriotCzechCzechoslovakianDanishDelawareDominicanDutchDutch West IndianEastern EuropeanEcuadorianEgyptianEnglishEstonianEthiopianEuropeanFijianFilipinoFinnishFrenchFrench American IndianFrench CanadianGermanGerman RussianGhanaianGreekGuamanian/ChamorroGuatemalanGuyaneseHaitianHmongHonduranHopiHoumaHungarianIcelanderIndian (Asian)IndonesianInupiatIranianIraqiIrishIroquoisIsraeliItalianJamaicanJapaneseJordanianKenyanKiowaKoreanLaotianLatvianLebaneseLiberianLithuanianLumbeeLuxembourgerMacedonianMalaysianMalteseMarshalleseMexicanMexican American IndianMongolianMoroccanNative HawaiianNavajoNepaleseNew ZealanderNicaraguanNigerianNorthern EuropeanNorwegianOkinawanOsageOttawaPaiutePakistaniPalestinianPanamanianParaguayanPennsylvania GermanPeruvianPimaPolishPortuguesePotawatomiPuebloPuerto RicanPuget Sound SalishRomanianRussianSalvadoranSamoanScandinavianScotch-IrishScottishSeminoleSenegaleseSerbianShoshoneSierra LeoneanSiouxSlavicSlovakSloveneSomaliSouth AfricanSouth AmericanSouth American IndianSoviet UnionSpaniardSpanishSpanish AmericanSpanish American IndianSri LankanSubsaharan AfricanSudaneseSwedishSwissSyrianTaiwaneseThaiTlingit-HaidaTohono O'OdhamTonganTrinidadian and TobagonianTsimshianTurkishU.S. Virgin IslanderUgandanUkrainianUruguayanUteVenezuelanVietnameseWelshWest IndianYakamaYaquiYugoslavianYumanYup'ikZimbabwean
Immigration
NonimmigrantsImmigrantsAfghanistanAfricaAlbaniaArgentinaArmeniaAsiaAustraliaAustriaBahamasBangladeshBarbadosBelarusBelgiumBelizeBoliviaBosnia and HerzegovinaBrazilBulgariaBurma/MyanmarCabo VerdeCambodiaCameroonCanadaCentral AmericaChileChinaColombiaCongoCosta RicaCroatiaCubaCzechoslovakiaDenmarkDominicaDominican RepublicEastern AfricaEastern AsiaEastern EuropeEcuadorEgyptEl SalvadorEnglandEritreaEthiopiaEuropeFijiFranceGermanyGhanaGreeceGrenadaGuatemalaGuyanaHaitiHondurasHong KongHungaryIndiaIndonesiaIranIraqIrelandIsraelItalyJamaicaJapanJordanKazakhstanKenyaKoreaKuwaitLaosLatin AmericaLatviaLebanonLiberiaLithuaniaMalaysiaMexicoMicronesiaMiddle AfricaMoldovaMoroccoNepalNetherlandsNicaraguaNigeriaNorth AmericaNorth MacedoniaNorthern AfricaNorthern EuropeNorwayOceaniaPakistanPanamaPeruPhilippinesPolandPortugalRomaniaRussiaSaudi ArabiaScotlandSenegalSerbiaSierra LeoneSingaporeSomaliaSouth AfricaSouth AmericaSouth Central AsiaSouth Eastern AsiaSouthern EuropeSpainSri LankaSt. Vincent and the GrenadinesSudanSwedenSwitzerlandSyriaTaiwanThailandTrinidad and TobagoTurkeyUgandaUkraineUruguayUzbekistanVenezuelaVietnamWest IndiesWestern AfricaWestern AsiaWestern EuropeYemenZaireZimbabweAzores
Immigrants from Caribbean
Race
Ancestry
AfghanAfricanAlaska NativeAlaskan AthabascanAlbanianAleutAlsatianAmericanApacheArabArapahoArgentineanArmenianAssyrian/Chaldean/SyriacAustralianAustrianBahamianBangladeshiBarbadianBasqueBelgianBelizeanBermudanBhutaneseBlackfeetBolivianBrazilianBritishBritish West IndianBulgarianBurmeseCajunCambodianCanadianCape VerdeanCarpatho RusynCelticCentral AmericanCentral American IndianCherokeeCheyenneChickasawChileanChineseChippewaChoctawColombianColvilleComancheCosta RicanCreeCreekCroatianCrowCubanCypriotCzechCzechoslovakianDanishDelawareDominicanDutchDutch West IndianEastern EuropeanEcuadorianEgyptianEnglishEstonianEthiopianEuropeanFijianFilipinoFinnishFrenchFrench American IndianFrench CanadianGermanGerman RussianGhanaianGreekGuamanian/ChamorroGuatemalanGuyaneseHaitianHmongHonduranHopiHoumaHungarianIcelanderIndian (Asian)IndonesianInupiatIranianIraqiIrishIroquoisItalianJamaicanJapaneseJordanianKenyanKiowaKoreanLaotianLatvianLebaneseLiberianLithuanianLumbeeLuxembourgerMacedonianMalaysianMalteseMarshalleseMexicanMexican American IndianMongolianMoroccanNative HawaiianNavajoNepaleseNew ZealanderNicaraguanNigerianNorthern EuropeanNorwegianOkinawanOsageOttawaPaiutePakistaniPalestinianPanamanianParaguayanPennsylvania GermanPeruvianPimaPolishPortuguesePotawatomiPuebloPuerto RicanPuget Sound SalishRomanianRussianSalvadoranSamoanScandinavianScotch-IrishScottishSeminoleSenegaleseSerbianShoshoneSierra LeoneanSiouxSlavicSlovakSloveneSomaliSouth AfricanSouth AmericanSouth American IndianSoviet UnionSpaniardSpanishSpanish AmericanSpanish American IndianSri LankanSubsaharan AfricanSudaneseSwedishSwissSyrianTaiwaneseThaiTlingit-HaidaTohono O'OdhamTonganTrinidadian and TobagonianTsimshianTurkishU.S. Virgin IslanderUgandanUkrainianUruguayanUteVenezuelanVietnameseWelshWest IndianYakamaYaquiYugoslavianYumanYup'ikZimbabwean
Immigration
NonimmigrantsImmigrantsAfghanistanAfricaAlbaniaArgentinaArmeniaAsiaAustraliaAustriaBahamasBangladeshBarbadosBelarusBelgiumBelizeBoliviaBosnia and HerzegovinaBrazilBulgariaBurma/MyanmarCabo VerdeCambodiaCameroonCanadaCaribbeanCentral AmericaChileChinaColombiaCongoCosta RicaCroatiaCubaCzechoslovakiaDenmarkDominicaDominican RepublicEastern AfricaEastern AsiaEastern EuropeEcuadorEgyptEl SalvadorEnglandEritreaEthiopiaEuropeFijiFranceGermanyGhanaGreeceGrenadaGuatemalaGuyanaHaitiHondurasHong KongHungaryIndiaIndonesiaIranIraqIrelandIsraelItalyJamaicaJapanJordanKazakhstanKenyaKoreaKuwaitLaosLatin AmericaLatviaLebanonLiberiaLithuaniaMalaysiaMexicoMicronesiaMiddle AfricaMoldovaMoroccoNepalNetherlandsNicaraguaNigeriaNorth AmericaNorth MacedoniaNorthern AfricaNorthern EuropeNorwayOceaniaPakistanPanamaPeruPhilippinesPolandPortugalRomaniaRussiaSaudi ArabiaScotlandSenegalSerbiaSierra LeoneSingaporeSomaliaSouth AfricaSouth AmericaSouth Central AsiaSouth Eastern AsiaSouthern EuropeSpainSri LankaSt. Vincent and the GrenadinesSudanSwedenSwitzerlandSyriaTaiwanThailandTrinidad and TobagoTurkeyUgandaUkraineUruguayUzbekistanVenezuelaVietnamWest IndiesWestern AfricaWestern AsiaWestern EuropeYemenZaireZimbabweAzores
Unemployment Among Seniors over 75 years
Income
Poverty
Unemployment
Labor Participation
Family Structure
Vehicle Availability
Education Level
Disability

Unemployment Among Seniors over 75 years Comparison

Israelis

Immigrants from Caribbean

Exceptional
Exceptional
7.4%
UNEMPLOYMENT AMONG SENIORS OVER 75 YEARS
100.0/ 100
METRIC RATING
23rd/ 347
METRIC RANK
8.2%
UNEMPLOYMENT AMONG SENIORS OVER 75 YEARS
99.0/ 100
METRIC RATING
105th/ 347
METRIC RANK

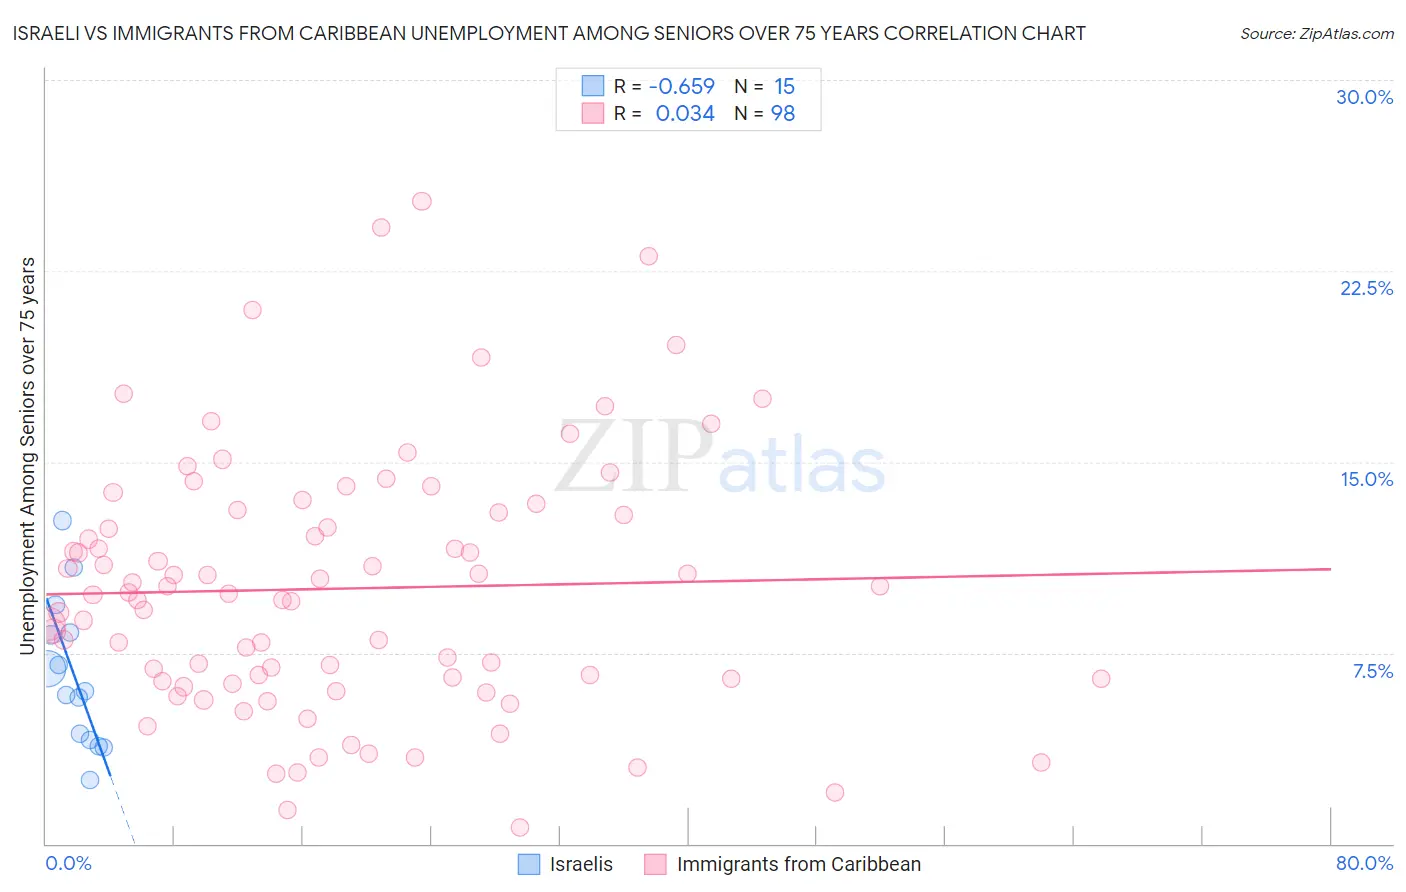
Israeli vs Immigrants from Caribbean Unemployment Among Seniors over 75 years Correlation Chart

The statistical analysis conducted on geographies consisting of 137,607,512 people shows a significant negative correlation between the proportion of Israelis and unemployment rate among seniors over the age of 75 in the United States with a correlation coefficient (R) of -0.659 and weighted average of 7.4%. Similarly, the statistical analysis conducted on geographies consisting of 215,050,799 people shows no correlation between the proportion of Immigrants from Caribbean and unemployment rate among seniors over the age of 75 in the United States with a correlation coefficient (R) of 0.034 and weighted average of 8.2%, a difference of 10.5%.
Israeli vs Immigrants from Caribbean Unemployment Among Seniors over 75 years

Unemployment Among Seniors over 75 years Correlation Summary

MeasurementIsraeliImmigrants from Caribbean
Minimum2.5%0.63%
Maximum12.7%25.3%
Range10.2%24.6%
Mean6.6%10.0%
Median6.0%9.8%
Interquartile 25% (IQ1)4.1%6.5%
Interquartile 75% (IQ3)8.3%13.0%
Interquartile Range (IQR)4.2%6.5%
Standard Deviation (Sample)2.9%5.0%
Standard Deviation (Population)2.8%5.0%

Similar Demographics by Unemployment Among Seniors over 75 years

Demographics Similar to Israelis by Unemployment Among Seniors over 75 years

In terms of unemployment among seniors over 75 years, the demographic groups most similar to Israelis are Immigrants from Cuba (7.4%, a difference of 0.080%), Cypriot (7.4%, a difference of 0.33%), Chickasaw (7.3%, a difference of 1.1%), Immigrants from Uruguay (7.5%, a difference of 1.2%), and South African (7.5%, a difference of 1.4%).
DemographicsRating | RankUnemployment Among Seniors over 75 years
Seminole
100.0
/100
|
#16
Exceptional
7.1%
Immigrants | Switzerland
100.0
/100
|
#17
Exceptional
7.2%
Immigrants | Uzbekistan
100.0
/100
|
#18
Exceptional
7.2%
Immigrants | Zaire
100.0
/100
|
#19
Exceptional
7.2%
Armenians
100.0
/100
|
#20
Exceptional
7.2%
Chickasaw
100.0
/100
|
#21
Exceptional
7.3%
Cypriots
100.0
/100
|
#22
Exceptional
7.4%
Israelis
100.0
/100
|
#23
Exceptional
7.4%
Immigrants | Cuba
100.0
/100
|
#24
Exceptional
7.4%
Immigrants | Uruguay
100.0
/100
|
#25
Exceptional
7.5%
South Africans
100.0
/100
|
#26
Exceptional
7.5%
Immigrants | Barbados
100.0
/100
|
#27
Exceptional
7.6%
Immigrants | Israel
100.0
/100
|
#28
Exceptional
7.6%
Immigrants | Iran
100.0
/100
|
#29
Exceptional
7.6%
Immigrants | Sweden
100.0
/100
|
#30
Exceptional
7.6%

Demographics Similar to Immigrants from Caribbean by Unemployment Among Seniors over 75 years

In terms of unemployment among seniors over 75 years, the demographic groups most similar to Immigrants from Caribbean are Immigrants from Honduras (8.2%, a difference of 0.010%), Immigrants from South Central Asia (8.2%, a difference of 0.020%), South American Indian (8.2%, a difference of 0.050%), Sri Lankan (8.2%, a difference of 0.17%), and Immigrants from Panama (8.2%, a difference of 0.20%).
DemographicsRating | RankUnemployment Among Seniors over 75 years
Immigrants | Northern Africa
99.3
/100
|
#98
Exceptional
8.2%
Burmese
99.2
/100
|
#99
Exceptional
8.2%
Immigrants | Kazakhstan
99.2
/100
|
#100
Exceptional
8.2%
Immigrants | Serbia
99.2
/100
|
#101
Exceptional
8.2%
Immigrants | Panama
99.1
/100
|
#102
Exceptional
8.2%
South American Indians
99.1
/100
|
#103
Exceptional
8.2%
Immigrants | South Central Asia
99.0
/100
|
#104
Exceptional
8.2%
Immigrants | Caribbean
99.0
/100
|
#105
Exceptional
8.2%
Immigrants | Honduras
99.0
/100
|
#106
Exceptional
8.2%
Sri Lankans
98.9
/100
|
#107
Exceptional
8.2%
Laotians
98.8
/100
|
#108
Exceptional
8.2%
Immigrants | Lebanon
98.8
/100
|
#109
Exceptional
8.2%
Marshallese
98.7
/100
|
#110
Exceptional
8.2%
French American Indians
98.7
/100
|
#111
Exceptional
8.2%
Immigrants | India
98.6
/100
|
#112
Exceptional
8.2%