Iroquois vs Immigrants from Albania Unemployment Among Seniors over 65 years

COMPARE

Iroquois
Race
Ancestry
AfghanAfricanAlaska NativeAlaskan AthabascanAlbanianAleutAlsatianAmericanApacheArabArapahoArgentineanArmenianAssyrian/Chaldean/SyriacAustralianAustrianBahamianBangladeshiBarbadianBasqueBelgianBelizeanBermudanBhutaneseBlackfeetBolivianBrazilianBritishBritish West IndianBulgarianBurmeseCajunCambodianCanadianCape VerdeanCarpatho RusynCelticCentral AmericanCentral American IndianCherokeeCheyenneChickasawChileanChineseChippewaChoctawColombianColvilleComancheCosta RicanCreeCreekCroatianCrowCubanCypriotCzechCzechoslovakianDanishDelawareDominicanDutchDutch West IndianEastern EuropeanEcuadorianEgyptianEnglishEstonianEthiopianEuropeanFijianFilipinoFinnishFrenchFrench American IndianFrench CanadianGermanGerman RussianGhanaianGreekGuamanian/ChamorroGuatemalanGuyaneseHaitianHmongHonduranHopiHoumaHungarianIcelanderIndian (Asian)IndonesianInupiatIranianIraqiIrishIroquoisIsraeliItalianJamaicanJapaneseJordanianKenyanKiowaKoreanLaotianLatvianLebaneseLiberianLithuanianLumbeeLuxembourgerMacedonianMalaysianMalteseMarshalleseMenomineeMexicanMexican American IndianMongolianMoroccanNative HawaiianNavajoNepaleseNew ZealanderNicaraguanNigerianNorthern EuropeanNorwegianOkinawanOsageOttawaPaiutePakistaniPalestinianPanamanianParaguayanPennsylvania GermanPeruvianPimaPolishPortuguesePotawatomiPuebloPuerto RicanPuget Sound SalishRomanianRussianSalvadoranSamoanScandinavianScotch-IrishScottishSeminoleSenegaleseSerbianShoshoneSierra LeoneanSiouxSlavicSlovakSloveneSomaliSouth AfricanSouth AmericanSouth American IndianSoviet UnionSpaniardSpanishSpanish AmericanSpanish American IndianSri LankanSubsaharan AfricanSudaneseSwedishSwissSyrianTaiwaneseThaiTlingit-HaidaTohono O'OdhamTonganTrinidadian and TobagonianTsimshianTurkishU.S. Virgin IslanderUgandanUkrainianUruguayanUteVenezuelanVietnameseWelshWest IndianYakamaYaquiYugoslavianYumanYup'ikZimbabwean
Immigration
NonimmigrantsImmigrantsAfghanistanAfricaArgentinaArmeniaAsiaAustraliaAustriaBahamasBangladeshBarbadosBelarusBelgiumBelizeBoliviaBosnia and HerzegovinaBrazilBulgariaBurma/MyanmarCabo VerdeCambodiaCameroonCanadaCaribbeanCentral AmericaChileChinaColombiaCongoCosta RicaCroatiaCubaCzechoslovakiaDenmarkDominicaDominican RepublicEastern AfricaEastern AsiaEastern EuropeEcuadorEgyptEl SalvadorEnglandEritreaEthiopiaEuropeFijiFranceGermanyGhanaGreeceGrenadaGuatemalaGuyanaHaitiHondurasHong KongHungaryIndiaIndonesiaIranIraqIrelandIsraelItalyJamaicaJapanJordanKazakhstanKenyaKoreaKuwaitLaosLatin AmericaLatviaLebanonLiberiaLithuaniaMalaysiaMexicoMicronesiaMiddle AfricaMoldovaMoroccoNepalNetherlandsNicaraguaNigeriaNorth AmericaNorth MacedoniaNorthern AfricaNorthern EuropeNorwayOceaniaPakistanPanamaPeruPhilippinesPolandPortugalRomaniaRussiaSaudi ArabiaScotlandSenegalSerbiaSierra LeoneSingaporeSomaliaSouth AfricaSouth AmericaSouth Central AsiaSouth Eastern AsiaSouthern EuropeSpainSri LankaSt. Vincent and the GrenadinesSudanSwedenSwitzerlandSyriaTaiwanThailandTrinidad and TobagoTurkeyUgandaUkraineUruguayUzbekistanVenezuelaVietnamWest IndiesWestern AfricaWestern AsiaWestern EuropeYemenZaireZimbabweAzores
Immigrants from Albania
Race
Ancestry
AfghanAfricanAlaska NativeAlaskan AthabascanAlbanianAleutAlsatianAmericanApacheArabArapahoArgentineanArmenianAssyrian/Chaldean/SyriacAustralianAustrianBahamianBangladeshiBarbadianBasqueBelgianBelizeanBermudanBhutaneseBlackfeetBolivianBrazilianBritishBritish West IndianBulgarianBurmeseCajunCambodianCanadianCape VerdeanCarpatho RusynCelticCentral AmericanCentral American IndianCherokeeCheyenneChickasawChileanChineseChippewaChoctawColombianColvilleComancheCosta RicanCreeCreekCroatianCrowCubanCypriotCzechCzechoslovakianDanishDelawareDominicanDutchDutch West IndianEastern EuropeanEcuadorianEgyptianEnglishEstonianEthiopianEuropeanFijianFilipinoFinnishFrenchFrench American IndianFrench CanadianGermanGerman RussianGhanaianGreekGuamanian/ChamorroGuatemalanGuyaneseHaitianHmongHonduranHopiHoumaHungarianIcelanderIndian (Asian)IndonesianInupiatIranianIraqiIrishIsraeliItalianJamaicanJapaneseJordanianKenyanKiowaKoreanLaotianLatvianLebaneseLiberianLithuanianLumbeeLuxembourgerMacedonianMalaysianMalteseMarshalleseMenomineeMexicanMexican American IndianMongolianMoroccanNative HawaiianNavajoNepaleseNew ZealanderNicaraguanNigerianNorthern EuropeanNorwegianOkinawanOsageOttawaPaiutePakistaniPalestinianPanamanianParaguayanPennsylvania GermanPeruvianPimaPolishPortuguesePotawatomiPuebloPuerto RicanPuget Sound SalishRomanianRussianSalvadoranSamoanScandinavianScotch-IrishScottishSeminoleSenegaleseSerbianShoshoneSierra LeoneanSiouxSlavicSlovakSloveneSomaliSouth AfricanSouth AmericanSouth American IndianSoviet UnionSpaniardSpanishSpanish AmericanSpanish American IndianSri LankanSubsaharan AfricanSudaneseSwedishSwissSyrianTaiwaneseThaiTlingit-HaidaTohono O'OdhamTonganTrinidadian and TobagonianTsimshianTurkishU.S. Virgin IslanderUgandanUkrainianUruguayanUteVenezuelanVietnameseWelshWest IndianYakamaYaquiYugoslavianYumanYup'ikZimbabwean
Immigration
NonimmigrantsImmigrantsAfghanistanAfricaAlbaniaArgentinaArmeniaAsiaAustraliaAustriaBahamasBangladeshBarbadosBelarusBelgiumBelizeBoliviaBosnia and HerzegovinaBrazilBulgariaBurma/MyanmarCabo VerdeCambodiaCameroonCanadaCaribbeanCentral AmericaChileChinaColombiaCongoCosta RicaCroatiaCubaCzechoslovakiaDenmarkDominicaDominican RepublicEastern AfricaEastern AsiaEastern EuropeEcuadorEgyptEl SalvadorEnglandEritreaEthiopiaEuropeFijiFranceGermanyGhanaGreeceGrenadaGuatemalaGuyanaHaitiHondurasHong KongHungaryIndiaIndonesiaIranIraqIrelandIsraelItalyJamaicaJapanJordanKazakhstanKenyaKoreaKuwaitLaosLatin AmericaLatviaLebanonLiberiaLithuaniaMalaysiaMexicoMicronesiaMiddle AfricaMoldovaMoroccoNepalNetherlandsNicaraguaNigeriaNorth AmericaNorth MacedoniaNorthern AfricaNorthern EuropeNorwayOceaniaPakistanPanamaPeruPhilippinesPolandPortugalRomaniaRussiaSaudi ArabiaScotlandSenegalSerbiaSierra LeoneSingaporeSomaliaSouth AfricaSouth AmericaSouth Central AsiaSouth Eastern AsiaSouthern EuropeSpainSri LankaSt. Vincent and the GrenadinesSudanSwedenSwitzerlandSyriaTaiwanThailandTrinidad and TobagoTurkeyUgandaUkraineUruguayUzbekistanVenezuelaVietnamWest IndiesWestern AfricaWestern AsiaWestern EuropeYemenZaireZimbabweAzores
Unemployment Among Seniors over 65 years
Income
Poverty
Unemployment
Labor Participation
Family Structure
Vehicle Availability
Education Level
Disability

Unemployment Among Seniors over 65 years Comparison

Iroquois

Immigrants from Albania

Exceptional
Tragic
4.9%
UNEMPLOYMENT AMONG SENIORS OVER 65 YEARS
99.5/ 100
METRIC RATING
67th/ 347
METRIC RANK
5.3%
UNEMPLOYMENT AMONG SENIORS OVER 65 YEARS
2.7/ 100
METRIC RATING
235th/ 347
METRIC RANK

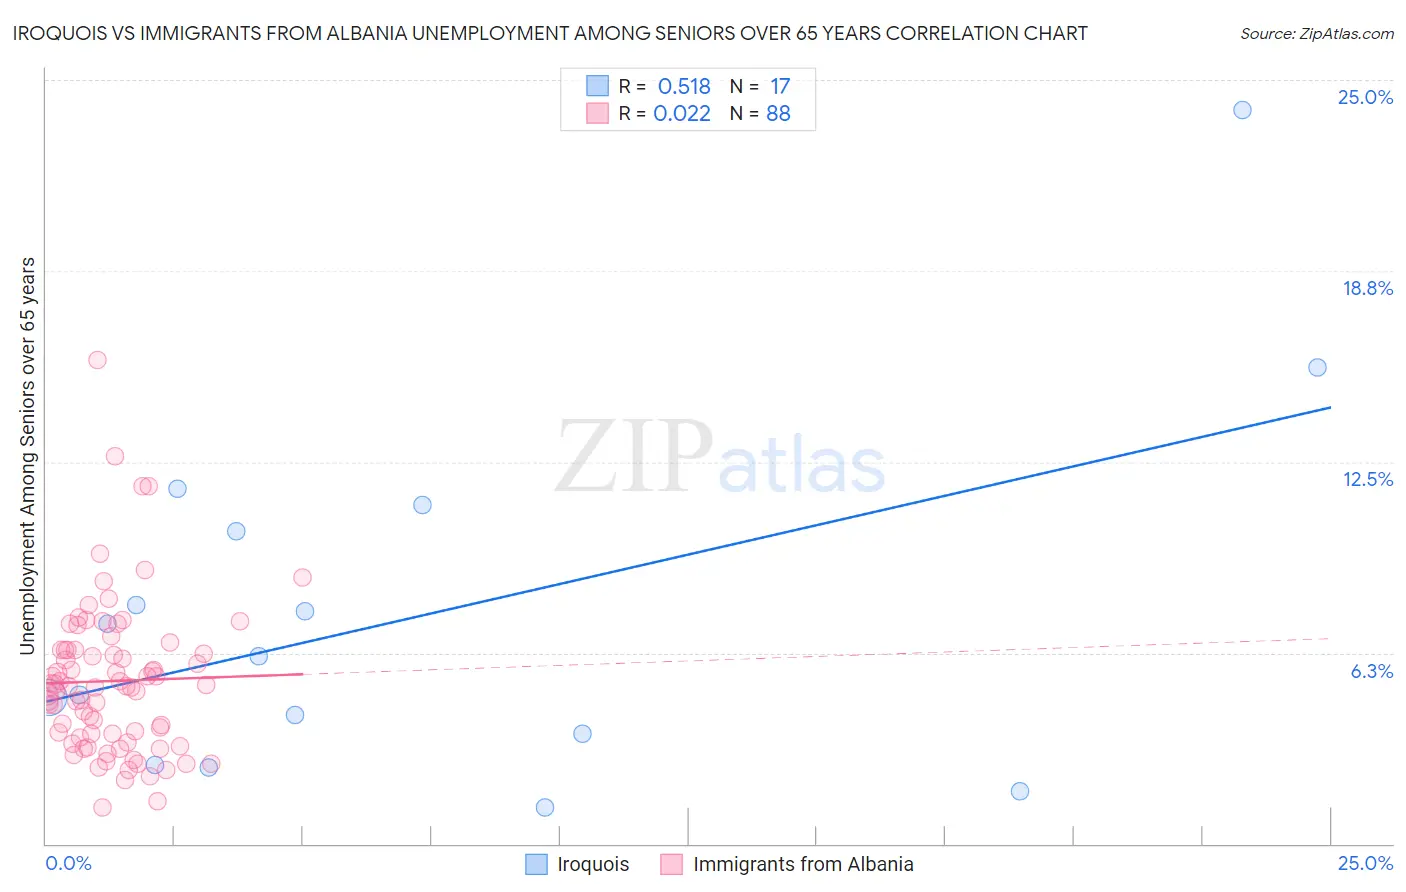
Iroquois vs Immigrants from Albania Unemployment Among Seniors over 65 years Correlation Chart

The statistical analysis conducted on geographies consisting of 190,755,899 people shows a substantial positive correlation between the proportion of Iroquois and unemployment rate amomg seniors over the age of 65 in the United States with a correlation coefficient (R) of 0.518 and weighted average of 4.9%. Similarly, the statistical analysis conducted on geographies consisting of 115,063,941 people shows no correlation between the proportion of Immigrants from Albania and unemployment rate amomg seniors over the age of 65 in the United States with a correlation coefficient (R) of 0.022 and weighted average of 5.3%, a difference of 7.5%.
Iroquois vs Immigrants from Albania Unemployment Among Seniors over 65 years

Unemployment Among Seniors over 65 years Correlation Summary

MeasurementIroquoisImmigrants from Albania
Minimum1.2%1.2%
Maximum24.0%15.9%
Range22.8%14.7%
Mean7.5%5.3%
Median6.1%5.1%
Interquartile 25% (IQ1)3.1%3.5%
Interquartile 75% (IQ3)10.7%6.3%
Interquartile Range (IQR)7.6%2.8%
Standard Deviation (Sample)5.8%2.5%
Standard Deviation (Population)5.6%2.5%

Similar Demographics by Unemployment Among Seniors over 65 years

Demographics Similar to Iroquois by Unemployment Among Seniors over 65 years

In terms of unemployment among seniors over 65 years, the demographic groups most similar to Iroquois are English (4.9%, a difference of 0.020%), Bolivian (4.9%, a difference of 0.030%), Immigrants from Nicaragua (4.9%, a difference of 0.070%), Scottish (4.9%, a difference of 0.080%), and Immigrants from Cambodia (4.9%, a difference of 0.15%).
DemographicsRating | RankUnemployment Among Seniors over 65 years
Immigrants | Middle Africa
99.7
/100
|
#60
Exceptional
4.9%
Northern Europeans
99.7
/100
|
#61
Exceptional
4.9%
Latvians
99.6
/100
|
#62
Exceptional
4.9%
Croatians
99.6
/100
|
#63
Exceptional
4.9%
Immigrants | Cambodia
99.6
/100
|
#64
Exceptional
4.9%
Immigrants | Nicaragua
99.6
/100
|
#65
Exceptional
4.9%
English
99.5
/100
|
#66
Exceptional
4.9%
Iroquois
99.5
/100
|
#67
Exceptional
4.9%
Bolivians
99.5
/100
|
#68
Exceptional
4.9%
Scottish
99.5
/100
|
#69
Exceptional
4.9%
Immigrants | Kazakhstan
99.4
/100
|
#70
Exceptional
4.9%
Immigrants | Moldova
99.4
/100
|
#71
Exceptional
4.9%
Nicaraguans
99.3
/100
|
#72
Exceptional
4.9%
Immigrants | Japan
99.2
/100
|
#73
Exceptional
4.9%
Japanese
99.2
/100
|
#74
Exceptional
4.9%

Demographics Similar to Immigrants from Albania by Unemployment Among Seniors over 65 years

In terms of unemployment among seniors over 65 years, the demographic groups most similar to Immigrants from Albania are Marshallese (5.3%, a difference of 0.10%), Blackfeet (5.3%, a difference of 0.10%), Hopi (5.3%, a difference of 0.19%), Immigrants from Costa Rica (5.3%, a difference of 0.19%), and Immigrants from Greece (5.3%, a difference of 0.25%).
DemographicsRating | RankUnemployment Among Seniors over 65 years
Haitians
4.4
/100
|
#228
Tragic
5.3%
Samoans
4.2
/100
|
#229
Tragic
5.3%
Immigrants | Argentina
4.0
/100
|
#230
Tragic
5.3%
Hungarians
3.9
/100
|
#231
Tragic
5.3%
Hopi
3.5
/100
|
#232
Tragic
5.3%
Marshallese
3.1
/100
|
#233
Tragic
5.3%
Blackfeet
3.1
/100
|
#234
Tragic
5.3%
Immigrants | Albania
2.7
/100
|
#235
Tragic
5.3%
Immigrants | Costa Rica
2.1
/100
|
#236
Tragic
5.3%
Immigrants | Greece
2.0
/100
|
#237
Tragic
5.3%
Immigrants | Israel
2.0
/100
|
#238
Tragic
5.3%
Immigrants | Senegal
1.8
/100
|
#239
Tragic
5.3%
Immigrants | Trinidad and Tobago
1.6
/100
|
#240
Tragic
5.3%
Apache
1.3
/100
|
#241
Tragic
5.3%
Bahamians
0.9
/100
|
#242
Tragic
5.3%