Irish vs Navajo Unemployment Among Ages 16 to 19 years
COMPARE
Irish
Navajo
Unemployment Among Ages 16 to 19 years
Unemployment Among Ages 16 to 19 years Comparison
Irish
Navajo
16.5%
UNEMPLOYMENT AMONG AGES 16 TO 19 YEARS
99.4/ 100
METRIC RATING
59th/ 347
METRIC RANK
29.0%
UNEMPLOYMENT AMONG AGES 16 TO 19 YEARS
0.0/ 100
METRIC RATING
343rd/ 347
METRIC RANK
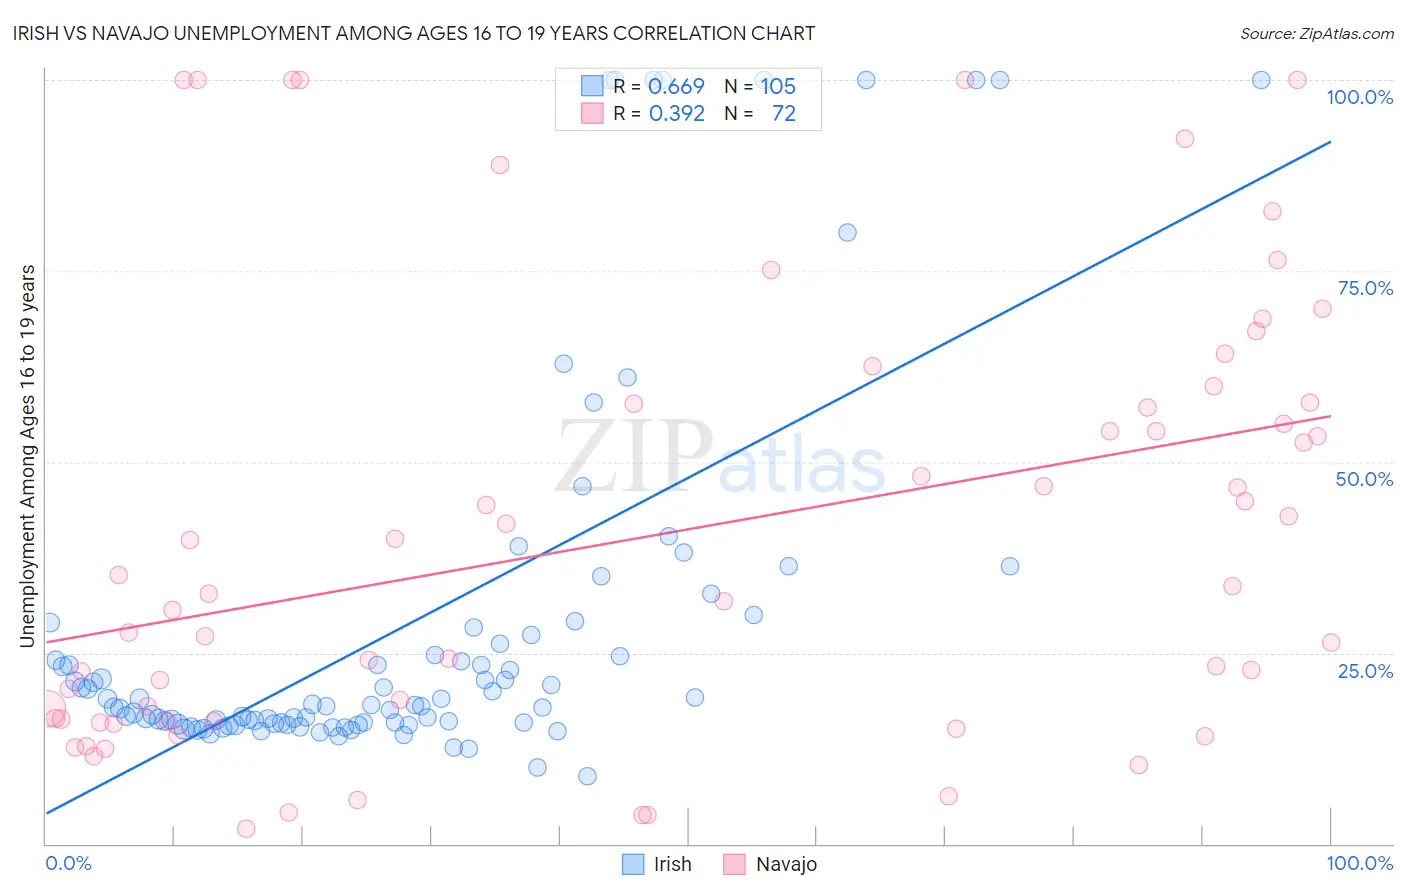
Irish vs Navajo Unemployment Among Ages 16 to 19 years Correlation Chart
The statistical analysis conducted on geographies consisting of 512,143,285 people shows a significant positive correlation between the proportion of Irish and unemployment rate among population between the ages 16 and 19 in the United States with a correlation coefficient (R) of 0.669 and weighted average of 16.5%. Similarly, the statistical analysis conducted on geographies consisting of 218,309,050 people shows a mild positive correlation between the proportion of Navajo and unemployment rate among population between the ages 16 and 19 in the United States with a correlation coefficient (R) of 0.392 and weighted average of 29.0%, a difference of 75.7%.
Unemployment Among Ages 16 to 19 years Correlation Summary
| Measurement | Irish | Navajo |
| Minimum | 8.8% | 1.9% |
| Maximum | 100.0% | 100.0% |
| Range | 91.2% | 98.1% |
| Mean | 28.6% | 40.7% |
| Median | 18.1% | 33.3% |
| Interquartile 25% (IQ1) | 15.8% | 16.2% |
| Interquartile 75% (IQ3) | 26.8% | 57.7% |
| Interquartile Range (IQR) | 11.0% | 41.5% |
| Standard Deviation (Sample) | 24.6% | 28.7% |
| Standard Deviation (Population) | 24.5% | 28.5% |
Similar Demographics by Unemployment Among Ages 16 to 19 years
Demographics Similar to Irish by Unemployment Among Ages 16 to 19 years
In terms of unemployment among ages 16 to 19 years, the demographic groups most similar to Irish are Immigrants from Uganda (16.5%, a difference of 0.050%), Immigrants from Jordan (16.5%, a difference of 0.10%), Menominee (16.6%, a difference of 0.17%), Immigrants from Cuba (16.6%, a difference of 0.23%), and Macedonian (16.6%, a difference of 0.33%).
| Demographics | Rating | Rank | Unemployment Among Ages 16 to 19 years |
| Welsh | 99.6 /100 | #52 | Exceptional 16.4% |
| Slovenes | 99.6 /100 | #53 | Exceptional 16.4% |
| British | 99.5 /100 | #54 | Exceptional 16.5% |
| Czechoslovakians | 99.5 /100 | #55 | Exceptional 16.5% |
| Sri Lankans | 99.5 /100 | #56 | Exceptional 16.5% |
| Immigrants | Jordan | 99.4 /100 | #57 | Exceptional 16.5% |
| Immigrants | Uganda | 99.4 /100 | #58 | Exceptional 16.5% |
| Irish | 99.4 /100 | #59 | Exceptional 16.5% |
| Menominee | 99.3 /100 | #60 | Exceptional 16.6% |
| Immigrants | Cuba | 99.2 /100 | #61 | Exceptional 16.6% |
| Macedonians | 99.2 /100 | #62 | Exceptional 16.6% |
| Scotch-Irish | 99.1 /100 | #63 | Exceptional 16.6% |
| Northern Europeans | 99.0 /100 | #64 | Exceptional 16.6% |
| Immigrants | Japan | 98.9 /100 | #65 | Exceptional 16.6% |
| Okinawans | 98.9 /100 | #66 | Exceptional 16.6% |
Demographics Similar to Navajo by Unemployment Among Ages 16 to 19 years
In terms of unemployment among ages 16 to 19 years, the demographic groups most similar to Navajo are Colville (29.7%, a difference of 2.2%), Inupiat (28.1%, a difference of 3.5%), Hopi (30.7%, a difference of 5.6%), Puerto Rican (27.5%, a difference of 5.6%), and Crow (26.2%, a difference of 10.7%).
| Demographics | Rating | Rank | Unemployment Among Ages 16 to 19 years |
| Paiute | 0.0 /100 | #333 | Tragic 24.4% |
| Guyanese | 0.0 /100 | #334 | Tragic 24.8% |
| Arapaho | 0.0 /100 | #335 | Tragic 25.2% |
| Kiowa | 0.0 /100 | #336 | Tragic 25.2% |
| Immigrants | Guyana | 0.0 /100 | #337 | Tragic 25.5% |
| Immigrants | St. Vincent and the Grenadines | 0.0 /100 | #338 | Tragic 25.7% |
| Immigrants | Grenada | 0.0 /100 | #339 | Tragic 25.7% |
| Crow | 0.0 /100 | #340 | Tragic 26.2% |
| Puerto Ricans | 0.0 /100 | #341 | Tragic 27.5% |
| Inupiat | 0.0 /100 | #342 | Tragic 28.1% |
| Navajo | 0.0 /100 | #343 | Tragic 29.0% |
| Colville | 0.0 /100 | #344 | Tragic 29.7% |
| Hopi | 0.0 /100 | #345 | Tragic 30.7% |
| Yuman | 0.0 /100 | #346 | Tragic 37.4% |
| Yup'ik | 0.0 /100 | #347 | Tragic 41.0% |