Irish vs Cherokee Unemployment Among Seniors over 75 years
COMPARE
Irish
Cherokee
Unemployment Among Seniors over 75 years
Unemployment Among Seniors over 75 years Comparison
Irish
Cherokee
10.2%
UNEMPLOYMENT AMONG SENIORS OVER 75 YEARS
0.0/ 100
METRIC RATING
317th/ 347
METRIC RANK
9.8%
UNEMPLOYMENT AMONG SENIORS OVER 75 YEARS
0.0/ 100
METRIC RATING
297th/ 347
METRIC RANK
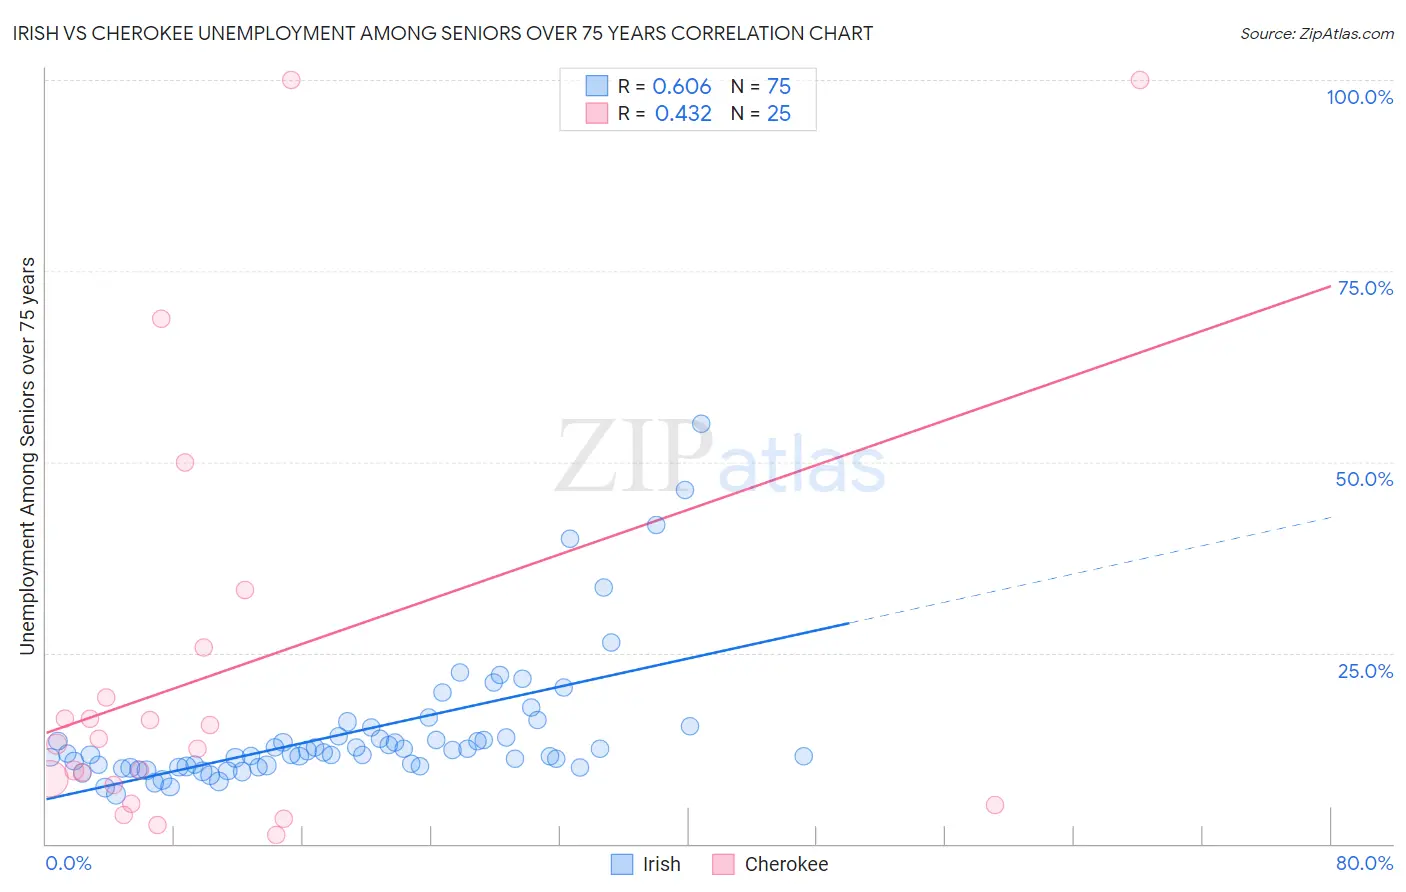
Irish vs Cherokee Unemployment Among Seniors over 75 years Correlation Chart
The statistical analysis conducted on geographies consisting of 235,224,616 people shows a significant positive correlation between the proportion of Irish and unemployment rate among seniors over the age of 75 in the United States with a correlation coefficient (R) of 0.606 and weighted average of 10.2%. Similarly, the statistical analysis conducted on geographies consisting of 219,338,381 people shows a moderate positive correlation between the proportion of Cherokee and unemployment rate among seniors over the age of 75 in the United States with a correlation coefficient (R) of 0.432 and weighted average of 9.8%, a difference of 3.9%.
Unemployment Among Seniors over 75 years Correlation Summary
| Measurement | Irish | Cherokee |
| Minimum | 6.5% | 1.2% |
| Maximum | 55.0% | 100.0% |
| Range | 48.5% | 98.8% |
| Mean | 14.6% | 22.7% |
| Median | 11.8% | 13.1% |
| Interquartile 25% (IQ1) | 10.1% | 6.5% |
| Interquartile 75% (IQ3) | 14.1% | 22.4% |
| Interquartile Range (IQR) | 4.0% | 15.9% |
| Standard Deviation (Sample) | 8.8% | 27.8% |
| Standard Deviation (Population) | 8.7% | 27.3% |
Demographics Similar to Irish and Cherokee by Unemployment Among Seniors over 75 years
In terms of unemployment among seniors over 75 years, the demographic groups most similar to Irish are Native/Alaskan (10.2%, a difference of 0.37%), Pennsylvania German (10.2%, a difference of 0.61%), Dutch West Indian (10.2%, a difference of 0.72%), Nepalese (10.1%, a difference of 1.2%), and Chippewa (10.1%, a difference of 1.3%). Similarly, the demographic groups most similar to Cherokee are Lithuanian (9.9%, a difference of 0.38%), Belgian (9.9%, a difference of 0.66%), Iraqi (9.9%, a difference of 0.68%), Welsh (10.0%, a difference of 1.1%), and Finnish (10.0%, a difference of 1.2%).
| Demographics | Rating | Rank | Unemployment Among Seniors over 75 years |
| Cherokee | 0.0 /100 | #297 | Tragic 9.8% |
| Lithuanians | 0.0 /100 | #298 | Tragic 9.9% |
| Belgians | 0.0 /100 | #299 | Tragic 9.9% |
| Iraqis | 0.0 /100 | #300 | Tragic 9.9% |
| Welsh | 0.0 /100 | #301 | Tragic 10.0% |
| Finns | 0.0 /100 | #302 | Tragic 10.0% |
| Puget Sound Salish | 0.0 /100 | #303 | Tragic 10.0% |
| Scotch-Irish | 0.0 /100 | #304 | Tragic 10.0% |
| Swedes | 0.0 /100 | #305 | Tragic 10.0% |
| Italians | 0.0 /100 | #306 | Tragic 10.0% |
| Immigrants | Fiji | 0.0 /100 | #307 | Tragic 10.0% |
| Whites/Caucasians | 0.0 /100 | #308 | Tragic 10.1% |
| English | 0.0 /100 | #309 | Tragic 10.1% |
| Hungarians | 0.0 /100 | #310 | Tragic 10.1% |
| Scottish | 0.0 /100 | #311 | Tragic 10.1% |
| Chippewa | 0.0 /100 | #312 | Tragic 10.1% |
| Nepalese | 0.0 /100 | #313 | Tragic 10.1% |
| Dutch West Indians | 0.0 /100 | #314 | Tragic 10.2% |
| Pennsylvania Germans | 0.0 /100 | #315 | Tragic 10.2% |
| Natives/Alaskans | 0.0 /100 | #316 | Tragic 10.2% |
| Irish | 0.0 /100 | #317 | Tragic 10.2% |