Iraqi vs Immigrants from Uganda Unemployment Among Seniors over 75 years

COMPARE

Iraqi
Race
Ancestry
AfghanAfricanAlaska NativeAlaskan AthabascanAlbanianAleutAlsatianAmericanApacheArabArapahoArgentineanArmenianAssyrian/Chaldean/SyriacAustralianAustrianBahamianBangladeshiBarbadianBasqueBelgianBelizeanBermudanBhutaneseBlackfeetBolivianBrazilianBritishBritish West IndianBulgarianBurmeseCajunCambodianCanadianCape VerdeanCarpatho RusynCelticCentral AmericanCentral American IndianCherokeeCheyenneChickasawChileanChineseChippewaChoctawColombianColvilleComancheCosta RicanCreeCreekCroatianCrowCubanCypriotCzechCzechoslovakianDanishDelawareDominicanDutchDutch West IndianEastern EuropeanEcuadorianEgyptianEnglishEstonianEthiopianEuropeanFijianFilipinoFinnishFrenchFrench American IndianFrench CanadianGermanGerman RussianGhanaianGreekGuamanian/ChamorroGuatemalanGuyaneseHaitianHmongHonduranHopiHoumaHungarianIcelanderIndian (Asian)IndonesianInupiatIranianIraqiIrishIroquoisIsraeliItalianJamaicanJapaneseJordanianKenyanKiowaKoreanLaotianLatvianLebaneseLiberianLithuanianLumbeeLuxembourgerMacedonianMalaysianMalteseMarshalleseMexicanMexican American IndianMongolianMoroccanNative HawaiianNavajoNepaleseNew ZealanderNicaraguanNigerianNorthern EuropeanNorwegianOkinawanOsageOttawaPaiutePakistaniPalestinianPanamanianParaguayanPennsylvania GermanPeruvianPimaPolishPortuguesePotawatomiPuebloPuerto RicanPuget Sound SalishRomanianRussianSalvadoranSamoanScandinavianScotch-IrishScottishSeminoleSenegaleseSerbianShoshoneSierra LeoneanSiouxSlavicSlovakSloveneSomaliSouth AfricanSouth AmericanSouth American IndianSoviet UnionSpaniardSpanishSpanish AmericanSpanish American IndianSri LankanSubsaharan AfricanSudaneseSwedishSwissSyrianTaiwaneseThaiTlingit-HaidaTohono O'OdhamTonganTrinidadian and TobagonianTsimshianTurkishU.S. Virgin IslanderUgandanUkrainianUruguayanUteVenezuelanVietnameseWelshWest IndianYakamaYaquiYugoslavianYumanYup'ikZimbabwean
Immigration
NonimmigrantsImmigrantsAfghanistanAfricaAlbaniaArgentinaArmeniaAsiaAustraliaAustriaBahamasBangladeshBarbadosBelarusBelgiumBelizeBoliviaBosnia and HerzegovinaBrazilBulgariaBurma/MyanmarCabo VerdeCambodiaCameroonCanadaCaribbeanCentral AmericaChileChinaColombiaCongoCosta RicaCroatiaCubaCzechoslovakiaDenmarkDominicaDominican RepublicEastern AfricaEastern AsiaEastern EuropeEcuadorEgyptEl SalvadorEnglandEritreaEthiopiaEuropeFijiFranceGermanyGhanaGreeceGrenadaGuatemalaGuyanaHaitiHondurasHong KongHungaryIndiaIndonesiaIranIraqIrelandIsraelItalyJamaicaJapanJordanKazakhstanKenyaKoreaKuwaitLaosLatin AmericaLatviaLebanonLiberiaLithuaniaMalaysiaMexicoMicronesiaMiddle AfricaMoldovaMoroccoNepalNetherlandsNicaraguaNigeriaNorth AmericaNorth MacedoniaNorthern AfricaNorthern EuropeNorwayOceaniaPakistanPanamaPeruPhilippinesPolandPortugalRomaniaRussiaSaudi ArabiaScotlandSenegalSerbiaSierra LeoneSingaporeSomaliaSouth AfricaSouth AmericaSouth Central AsiaSouth Eastern AsiaSouthern EuropeSpainSri LankaSt. Vincent and the GrenadinesSudanSwedenSwitzerlandSyriaTaiwanThailandTrinidad and TobagoTurkeyUkraineUruguayUzbekistanVenezuelaVietnamWest IndiesWestern AfricaWestern AsiaWestern EuropeYemenZaireZimbabweAzores
Immigrants from Uganda
Race
Ancestry
AfghanAfricanAlaska NativeAlaskan AthabascanAlbanianAleutAlsatianAmericanApacheArabArapahoArgentineanArmenianAssyrian/Chaldean/SyriacAustralianAustrianBahamianBangladeshiBarbadianBasqueBelgianBelizeanBermudanBhutaneseBlackfeetBolivianBrazilianBritishBritish West IndianBulgarianBurmeseCajunCambodianCanadianCape VerdeanCarpatho RusynCelticCentral AmericanCentral American IndianCherokeeCheyenneChickasawChileanChineseChippewaChoctawColombianColvilleComancheCosta RicanCreeCreekCroatianCrowCubanCypriotCzechCzechoslovakianDanishDelawareDominicanDutchDutch West IndianEastern EuropeanEcuadorianEgyptianEnglishEstonianEthiopianEuropeanFijianFilipinoFinnishFrenchFrench American IndianFrench CanadianGermanGerman RussianGhanaianGreekGuamanian/ChamorroGuatemalanGuyaneseHaitianHmongHonduranHopiHoumaHungarianIcelanderIndian (Asian)IndonesianInupiatIranianIrishIroquoisIsraeliItalianJamaicanJapaneseJordanianKenyanKiowaKoreanLaotianLatvianLebaneseLiberianLithuanianLumbeeLuxembourgerMacedonianMalaysianMalteseMarshalleseMexicanMexican American IndianMongolianMoroccanNative HawaiianNavajoNepaleseNew ZealanderNicaraguanNigerianNorthern EuropeanNorwegianOkinawanOsageOttawaPaiutePakistaniPalestinianPanamanianParaguayanPennsylvania GermanPeruvianPimaPolishPortuguesePotawatomiPuebloPuerto RicanPuget Sound SalishRomanianRussianSalvadoranSamoanScandinavianScotch-IrishScottishSeminoleSenegaleseSerbianShoshoneSierra LeoneanSiouxSlavicSlovakSloveneSomaliSouth AfricanSouth AmericanSouth American IndianSoviet UnionSpaniardSpanishSpanish AmericanSpanish American IndianSri LankanSubsaharan AfricanSudaneseSwedishSwissSyrianTaiwaneseThaiTlingit-HaidaTohono O'OdhamTonganTrinidadian and TobagonianTsimshianTurkishU.S. Virgin IslanderUgandanUkrainianUruguayanUteVenezuelanVietnameseWelshWest IndianYakamaYaquiYugoslavianYumanYup'ikZimbabwean
Immigration
NonimmigrantsImmigrantsAfghanistanAfricaAlbaniaArgentinaArmeniaAsiaAustraliaAustriaBahamasBangladeshBarbadosBelarusBelgiumBelizeBoliviaBosnia and HerzegovinaBrazilBulgariaBurma/MyanmarCabo VerdeCambodiaCameroonCanadaCaribbeanCentral AmericaChileChinaColombiaCongoCosta RicaCroatiaCubaCzechoslovakiaDenmarkDominicaDominican RepublicEastern AfricaEastern AsiaEastern EuropeEcuadorEgyptEl SalvadorEnglandEritreaEthiopiaEuropeFijiFranceGermanyGhanaGreeceGrenadaGuatemalaGuyanaHaitiHondurasHong KongHungaryIndiaIndonesiaIranIraqIrelandIsraelItalyJamaicaJapanJordanKazakhstanKenyaKoreaKuwaitLaosLatin AmericaLatviaLebanonLiberiaLithuaniaMalaysiaMexicoMicronesiaMiddle AfricaMoldovaMoroccoNepalNetherlandsNicaraguaNigeriaNorth AmericaNorth MacedoniaNorthern AfricaNorthern EuropeNorwayOceaniaPakistanPanamaPeruPhilippinesPolandPortugalRomaniaRussiaSaudi ArabiaScotlandSenegalSerbiaSierra LeoneSingaporeSomaliaSouth AfricaSouth AmericaSouth Central AsiaSouth Eastern AsiaSouthern EuropeSpainSri LankaSt. Vincent and the GrenadinesSudanSwedenSwitzerlandSyriaTaiwanThailandTrinidad and TobagoTurkeyUgandaUkraineUruguayUzbekistanVenezuelaVietnamWest IndiesWestern AfricaWestern AsiaWestern EuropeYemenZaireZimbabweAzores
Unemployment Among Seniors over 75 years
Income
Poverty
Unemployment
Labor Participation
Family Structure
Vehicle Availability
Education Level
Disability

Unemployment Among Seniors over 75 years Comparison

Iraqis

Immigrants from Uganda

Tragic
Exceptional
9.9%
UNEMPLOYMENT AMONG SENIORS OVER 75 YEARS
0.0/ 100
METRIC RATING
300th/ 347
METRIC RANK
8.0%
UNEMPLOYMENT AMONG SENIORS OVER 75 YEARS
99.8/ 100
METRIC RATING
75th/ 347
METRIC RANK

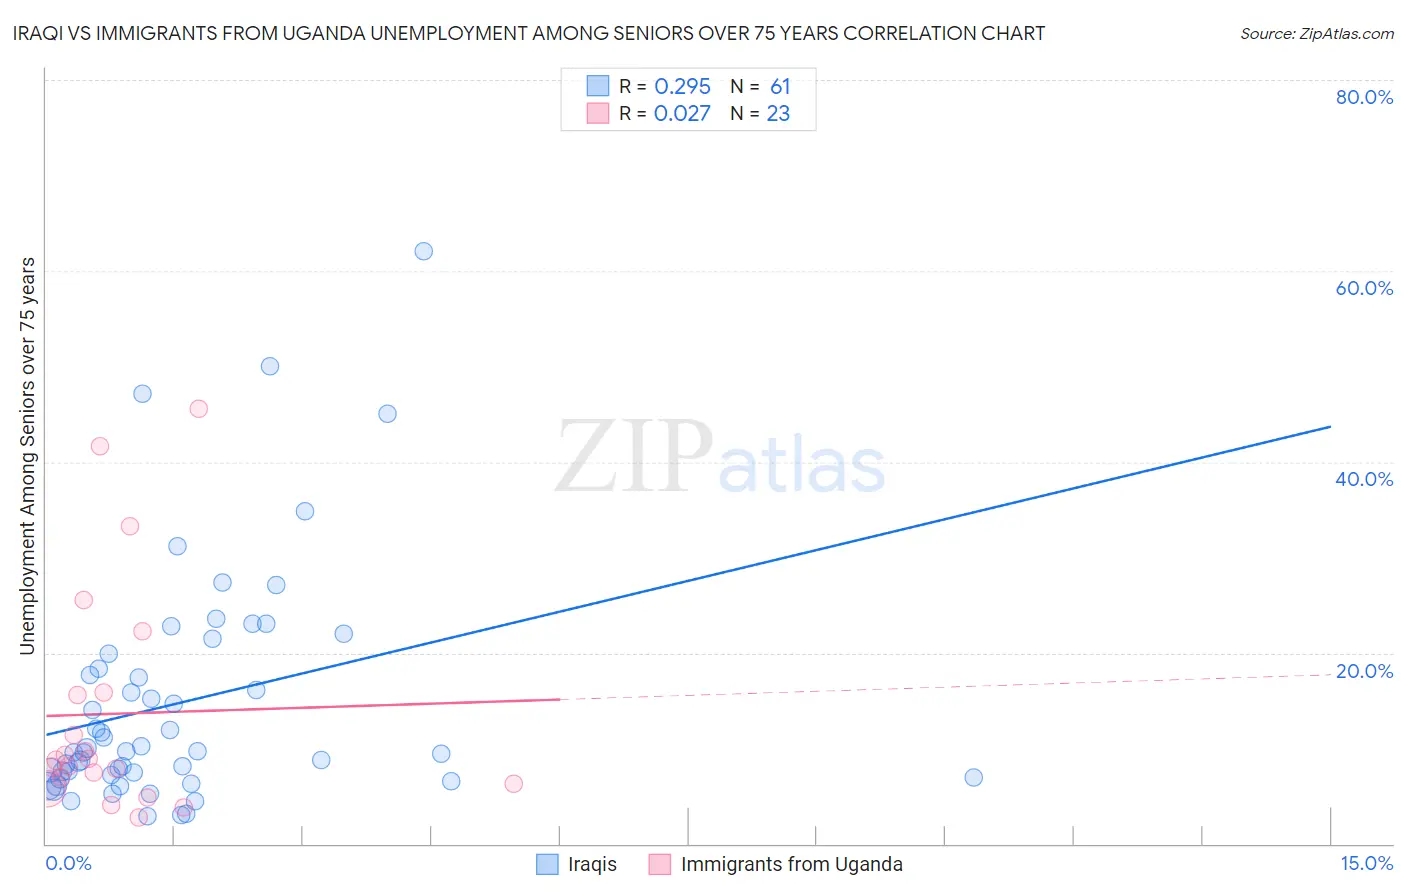
Iraqi vs Immigrants from Uganda Unemployment Among Seniors over 75 years Correlation Chart

The statistical analysis conducted on geographies consisting of 115,349,055 people shows a weak positive correlation between the proportion of Iraqis and unemployment rate among seniors over the age of 75 in the United States with a correlation coefficient (R) of 0.295 and weighted average of 9.9%. Similarly, the statistical analysis conducted on geographies consisting of 92,923,219 people shows no correlation between the proportion of Immigrants from Uganda and unemployment rate among seniors over the age of 75 in the United States with a correlation coefficient (R) of 0.027 and weighted average of 8.0%, a difference of 23.7%.
Iraqi vs Immigrants from Uganda Unemployment Among Seniors over 75 years

Unemployment Among Seniors over 75 years Correlation Summary

MeasurementIraqiImmigrants from Uganda
Minimum2.9%2.7%
Maximum62.1%45.5%
Range59.2%42.8%
Mean14.7%13.6%
Median9.6%8.7%
Interquartile 25% (IQ1)7.1%6.3%
Interquartile 75% (IQ3)19.1%15.8%
Interquartile Range (IQR)12.0%9.5%
Standard Deviation (Sample)12.3%12.0%
Standard Deviation (Population)12.2%11.8%

Similar Demographics by Unemployment Among Seniors over 75 years

Demographics Similar to Iraqis by Unemployment Among Seniors over 75 years

In terms of unemployment among seniors over 75 years, the demographic groups most similar to Iraqis are Belgian (9.9%, a difference of 0.020%), Lithuanian (9.9%, a difference of 0.30%), Welsh (10.0%, a difference of 0.42%), Finnish (10.0%, a difference of 0.53%), and Puget Sound Salish (10.0%, a difference of 0.60%).
DemographicsRating | RankUnemployment Among Seniors over 75 years
Norwegians
0.0
/100
|
#293
Tragic
9.8%
Immigrants | Dominica
0.0
/100
|
#294
Tragic
9.8%
Immigrants | Nonimmigrants
0.0
/100
|
#295
Tragic
9.8%
Immigrants | St. Vincent and the Grenadines
0.0
/100
|
#296
Tragic
9.8%
Cherokee
0.0
/100
|
#297
Tragic
9.8%
Lithuanians
0.0
/100
|
#298
Tragic
9.9%
Belgians
0.0
/100
|
#299
Tragic
9.9%
Iraqis
0.0
/100
|
#300
Tragic
9.9%
Welsh
0.0
/100
|
#301
Tragic
10.0%
Finns
0.0
/100
|
#302
Tragic
10.0%
Puget Sound Salish
0.0
/100
|
#303
Tragic
10.0%
Scotch-Irish
0.0
/100
|
#304
Tragic
10.0%
Swedes
0.0
/100
|
#305
Tragic
10.0%
Italians
0.0
/100
|
#306
Tragic
10.0%
Immigrants | Fiji
0.0
/100
|
#307
Tragic
10.0%

Demographics Similar to Immigrants from Uganda by Unemployment Among Seniors over 75 years

In terms of unemployment among seniors over 75 years, the demographic groups most similar to Immigrants from Uganda are Immigrants from Venezuela (8.0%, a difference of 0.11%), Immigrants from Turkey (8.0%, a difference of 0.16%), Immigrants from Belarus (8.0%, a difference of 0.19%), Spanish American (8.0%, a difference of 0.35%), and Immigrants from France (8.0%, a difference of 0.39%).
DemographicsRating | RankUnemployment Among Seniors over 75 years
Immigrants | South Africa
99.9
/100
|
#68
Exceptional
8.0%
Indians (Asian)
99.9
/100
|
#69
Exceptional
8.0%
Immigrants | Argentina
99.9
/100
|
#70
Exceptional
8.0%
Immigrants | Cambodia
99.9
/100
|
#71
Exceptional
8.0%
Bolivians
99.9
/100
|
#72
Exceptional
8.0%
Immigrants | France
99.9
/100
|
#73
Exceptional
8.0%
Spanish Americans
99.8
/100
|
#74
Exceptional
8.0%
Immigrants | Uganda
99.8
/100
|
#75
Exceptional
8.0%
Immigrants | Venezuela
99.8
/100
|
#76
Exceptional
8.0%
Immigrants | Turkey
99.8
/100
|
#77
Exceptional
8.0%
Immigrants | Belarus
99.8
/100
|
#78
Exceptional
8.0%
Immigrants | Japan
99.7
/100
|
#79
Exceptional
8.0%
Immigrants | Australia
99.7
/100
|
#80
Exceptional
8.0%
Cubans
99.7
/100
|
#81
Exceptional
8.0%
Bhutanese
99.7
/100
|
#82
Exceptional
8.0%