Iraqi vs Bolivian Unemployment Among Ages 45 to 54 years

COMPARE

Iraqi
Race
Ancestry
AfghanAfricanAlaska NativeAlaskan AthabascanAlbanianAleutAlsatianAmericanApacheArabArapahoArgentineanArmenianAssyrian/Chaldean/SyriacAustralianAustrianBahamianBangladeshiBarbadianBasqueBelgianBelizeanBermudanBhutaneseBlackfeetBrazilianBritishBritish West IndianBulgarianBurmeseCajunCambodianCanadianCape VerdeanCarpatho RusynCelticCentral AmericanCentral American IndianCherokeeCheyenneChickasawChileanChineseChippewaChoctawColombianColvilleComancheCosta RicanCreeCreekCroatianCrowCubanCypriotCzechCzechoslovakianDanishDelawareDominicanDutchDutch West IndianEastern EuropeanEcuadorianEgyptianEnglishEstonianEthiopianEuropeanFijianFilipinoFinnishFrenchFrench American IndianFrench CanadianGermanGerman RussianGhanaianGreekGuamanian/ChamorroGuatemalanGuyaneseHaitianHmongHonduranHopiHoumaHungarianIcelanderIndian (Asian)IndonesianInupiatIranianIraqiIrishIroquoisIsraeliItalianJamaicanJapaneseJordanianKenyanKiowaKoreanLaotianLatvianLebaneseLiberianLithuanianLumbeeLuxembourgerMacedonianMalaysianMalteseMarshalleseMenomineeMexicanMexican American IndianMongolianMoroccanNative HawaiianNavajoNepaleseNew ZealanderNicaraguanNigerianNorthern EuropeanNorwegianOkinawanOsageOttawaPaiutePakistaniPalestinianPanamanianParaguayanPennsylvania GermanPeruvianPimaPolishPortuguesePotawatomiPuebloPuerto RicanPuget Sound SalishRomanianRussianSalvadoranSamoanScandinavianScotch-IrishScottishSeminoleSenegaleseSerbianShoshoneSierra LeoneanSiouxSlavicSlovakSloveneSomaliSouth AfricanSouth AmericanSouth American IndianSoviet UnionSpaniardSpanishSpanish AmericanSpanish American IndianSri LankanSubsaharan AfricanSudaneseSwedishSwissSyrianTaiwaneseThaiTlingit-HaidaTohono O'OdhamTonganTrinidadian and TobagonianTsimshianTurkishU.S. Virgin IslanderUgandanUkrainianUruguayanUteVenezuelanVietnameseWelshWest IndianYakamaYaquiYugoslavianYumanYup'ikZimbabwean
Immigration
NonimmigrantsImmigrantsAfghanistanAfricaAlbaniaArgentinaArmeniaAsiaAustraliaAustriaBahamasBangladeshBarbadosBelarusBelgiumBelizeBoliviaBosnia and HerzegovinaBrazilBulgariaBurma/MyanmarCabo VerdeCambodiaCameroonCanadaCaribbeanCentral AmericaChileChinaColombiaCongoCosta RicaCroatiaCubaCzechoslovakiaDenmarkDominicaDominican RepublicEastern AfricaEastern AsiaEastern EuropeEcuadorEgyptEl SalvadorEnglandEritreaEthiopiaEuropeFijiFranceGermanyGhanaGreeceGrenadaGuatemalaGuyanaHaitiHondurasHong KongHungaryIndiaIndonesiaIranIraqIrelandIsraelItalyJamaicaJapanJordanKazakhstanKenyaKoreaKuwaitLaosLatin AmericaLatviaLebanonLiberiaLithuaniaMalaysiaMexicoMicronesiaMiddle AfricaMoldovaMoroccoNepalNetherlandsNicaraguaNigeriaNorth AmericaNorth MacedoniaNorthern AfricaNorthern EuropeNorwayOceaniaPakistanPanamaPeruPhilippinesPolandPortugalRomaniaRussiaSaudi ArabiaScotlandSenegalSerbiaSierra LeoneSingaporeSomaliaSouth AfricaSouth AmericaSouth Central AsiaSouth Eastern AsiaSouthern EuropeSpainSri LankaSt. Vincent and the GrenadinesSudanSwedenSwitzerlandSyriaTaiwanThailandTrinidad and TobagoTurkeyUgandaUkraineUruguayUzbekistanVenezuelaVietnamWest IndiesWestern AfricaWestern AsiaWestern EuropeYemenZaireZimbabweAzores
Bolivian
Race
Ancestry
AfghanAfricanAlaska NativeAlaskan AthabascanAlbanianAleutAlsatianAmericanApacheArabArapahoArgentineanArmenianAssyrian/Chaldean/SyriacAustralianAustrianBahamianBangladeshiBarbadianBasqueBelgianBelizeanBermudanBhutaneseBlackfeetBolivianBrazilianBritishBritish West IndianBulgarianBurmeseCajunCambodianCanadianCape VerdeanCarpatho RusynCelticCentral AmericanCentral American IndianCherokeeCheyenneChickasawChileanChineseChippewaChoctawColombianColvilleComancheCosta RicanCreeCreekCroatianCrowCubanCypriotCzechCzechoslovakianDanishDelawareDominicanDutchDutch West IndianEastern EuropeanEcuadorianEgyptianEnglishEstonianEthiopianEuropeanFijianFilipinoFinnishFrenchFrench American IndianFrench CanadianGermanGerman RussianGhanaianGreekGuamanian/ChamorroGuatemalanGuyaneseHaitianHmongHonduranHopiHoumaHungarianIcelanderIndian (Asian)IndonesianInupiatIranianIrishIroquoisIsraeliItalianJamaicanJapaneseJordanianKenyanKiowaKoreanLaotianLatvianLebaneseLiberianLithuanianLumbeeLuxembourgerMacedonianMalaysianMalteseMarshalleseMenomineeMexicanMexican American IndianMongolianMoroccanNative HawaiianNavajoNepaleseNew ZealanderNicaraguanNigerianNorthern EuropeanNorwegianOkinawanOsageOttawaPaiutePakistaniPalestinianPanamanianParaguayanPennsylvania GermanPeruvianPimaPolishPortuguesePotawatomiPuebloPuerto RicanPuget Sound SalishRomanianRussianSalvadoranSamoanScandinavianScotch-IrishScottishSeminoleSenegaleseSerbianShoshoneSierra LeoneanSiouxSlavicSlovakSloveneSomaliSouth AfricanSouth AmericanSouth American IndianSoviet UnionSpaniardSpanishSpanish AmericanSpanish American IndianSri LankanSubsaharan AfricanSudaneseSwedishSwissSyrianTaiwaneseThaiTlingit-HaidaTohono O'OdhamTonganTrinidadian and TobagonianTsimshianTurkishU.S. Virgin IslanderUgandanUkrainianUruguayanUteVenezuelanVietnameseWelshWest IndianYakamaYaquiYugoslavianYumanYup'ikZimbabwean
Immigration
NonimmigrantsImmigrantsAfghanistanAfricaAlbaniaArgentinaArmeniaAsiaAustraliaAustriaBahamasBangladeshBarbadosBelarusBelgiumBelizeBoliviaBosnia and HerzegovinaBrazilBulgariaBurma/MyanmarCabo VerdeCambodiaCameroonCanadaCaribbeanCentral AmericaChileChinaColombiaCongoCosta RicaCroatiaCubaCzechoslovakiaDenmarkDominicaDominican RepublicEastern AfricaEastern AsiaEastern EuropeEcuadorEgyptEl SalvadorEnglandEritreaEthiopiaEuropeFijiFranceGermanyGhanaGreeceGrenadaGuatemalaGuyanaHaitiHondurasHong KongHungaryIndiaIndonesiaIranIraqIrelandIsraelItalyJamaicaJapanJordanKazakhstanKenyaKoreaKuwaitLaosLatin AmericaLatviaLebanonLiberiaLithuaniaMalaysiaMexicoMicronesiaMiddle AfricaMoldovaMoroccoNepalNetherlandsNicaraguaNigeriaNorth AmericaNorth MacedoniaNorthern AfricaNorthern EuropeNorwayOceaniaPakistanPanamaPeruPhilippinesPolandPortugalRomaniaRussiaSaudi ArabiaScotlandSenegalSerbiaSierra LeoneSingaporeSomaliaSouth AfricaSouth AmericaSouth Central AsiaSouth Eastern AsiaSouthern EuropeSpainSri LankaSt. Vincent and the GrenadinesSudanSwedenSwitzerlandSyriaTaiwanThailandTrinidad and TobagoTurkeyUgandaUkraineUruguayUzbekistanVenezuelaVietnamWest IndiesWestern AfricaWestern AsiaWestern EuropeYemenZaireZimbabweAzores
Unemployment Among Ages 45 to 54 years
Income
Poverty
Unemployment
Labor Participation
Family Structure
Vehicle Availability
Education Level
Disability

Unemployment Among Ages 45 to 54 years Comparison

Iraqis

Bolivians

Tragic
Exceptional
4.7%
UNEMPLOYMENT AMONG AGES 45 TO 54 YEARS
3.2/ 100
METRIC RATING
227th/ 347
METRIC RANK
4.1%
UNEMPLOYMENT AMONG AGES 45 TO 54 YEARS
99.9/ 100
METRIC RATING
25th/ 347
METRIC RANK

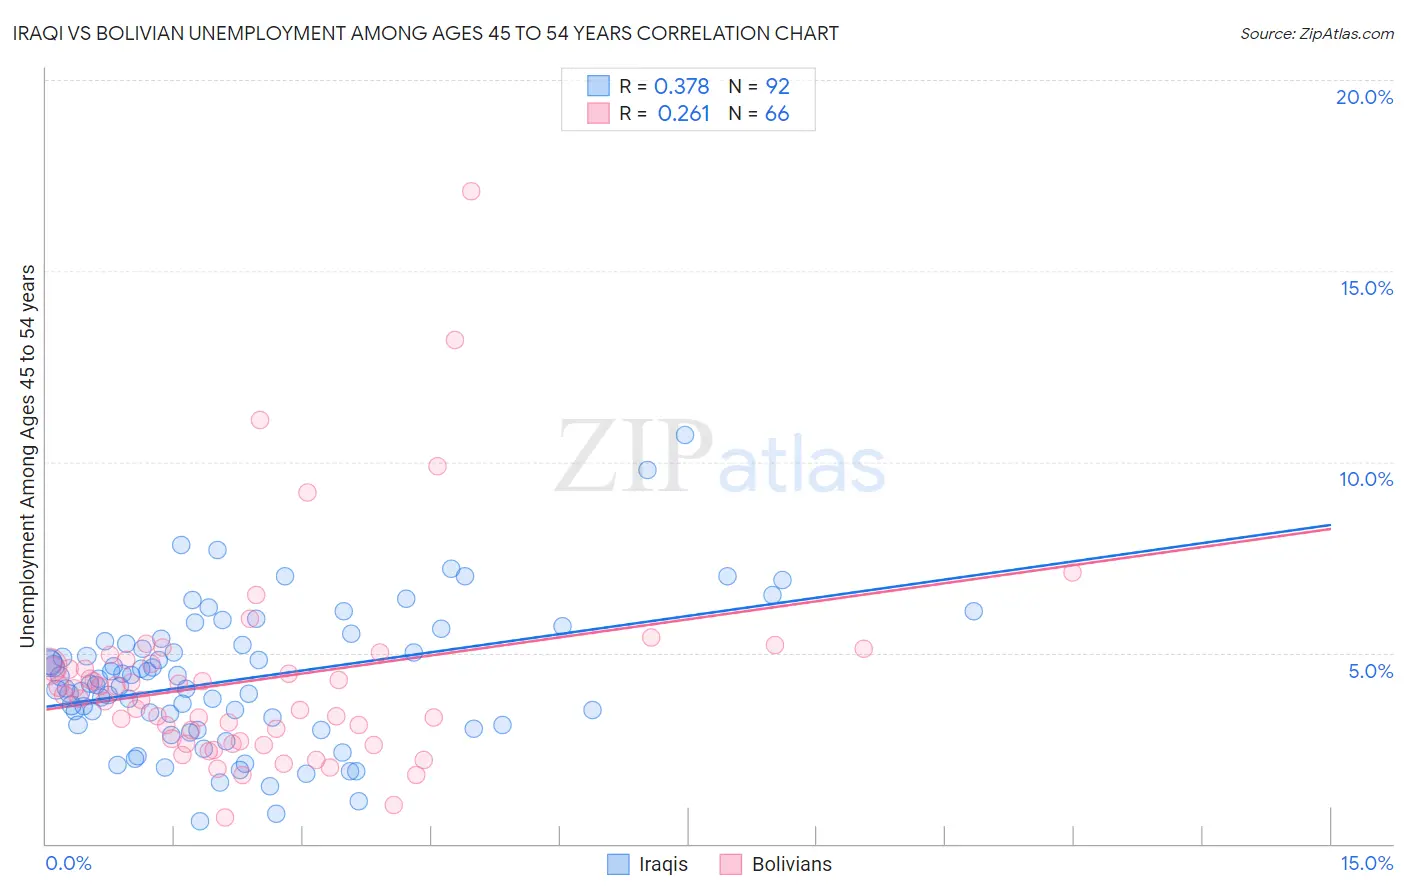
Iraqi vs Bolivian Unemployment Among Ages 45 to 54 years Correlation Chart

The statistical analysis conducted on geographies consisting of 169,145,598 people shows a mild positive correlation between the proportion of Iraqis and unemployment rate among population between the ages 45 and 54 in the United States with a correlation coefficient (R) of 0.378 and weighted average of 4.7%. Similarly, the statistical analysis conducted on geographies consisting of 183,005,663 people shows a weak positive correlation between the proportion of Bolivians and unemployment rate among population between the ages 45 and 54 in the United States with a correlation coefficient (R) of 0.261 and weighted average of 4.1%, a difference of 14.1%.
Iraqi vs Bolivian Unemployment Among Ages 45 to 54 years

Unemployment Among Ages 45 to 54 years Correlation Summary

MeasurementIraqiBolivian
Minimum0.60%0.70%
Maximum10.7%17.1%
Range10.1%16.4%
Mean4.3%4.3%
Median4.2%3.8%
Interquartile 25% (IQ1)3.1%2.7%
Interquartile 75% (IQ3)5.3%4.7%
Interquartile Range (IQR)2.2%2.0%
Standard Deviation (Sample)1.8%2.7%
Standard Deviation (Population)1.8%2.7%

Similar Demographics by Unemployment Among Ages 45 to 54 years

Demographics Similar to Iraqis by Unemployment Among Ages 45 to 54 years

In terms of unemployment among ages 45 to 54 years, the demographic groups most similar to Iraqis are South American Indian (4.7%, a difference of 0.030%), Immigrants from Israel (4.7%, a difference of 0.080%), Assyrian/Chaldean/Syriac (4.7%, a difference of 0.090%), Japanese (4.7%, a difference of 0.16%), and Immigrants from Ireland (4.7%, a difference of 0.19%).
DemographicsRating | RankUnemployment Among Ages 45 to 54 years
Guamanians/Chamorros
6.8
/100
|
#220
Tragic
4.7%
Choctaw
6.1
/100
|
#221
Tragic
4.7%
Immigrants | Southern Europe
6.0
/100
|
#222
Tragic
4.7%
Potawatomi
5.7
/100
|
#223
Tragic
4.7%
Comanche
4.8
/100
|
#224
Tragic
4.7%
Immigrants | Norway
4.8
/100
|
#225
Tragic
4.7%
Assyrians/Chaldeans/Syriacs
3.5
/100
|
#226
Tragic
4.7%
Iraqis
3.2
/100
|
#227
Tragic
4.7%
South American Indians
3.1
/100
|
#228
Tragic
4.7%
Immigrants | Israel
3.0
/100
|
#229
Tragic
4.7%
Japanese
2.8
/100
|
#230
Tragic
4.7%
Immigrants | Ireland
2.7
/100
|
#231
Tragic
4.7%
Ottawa
2.7
/100
|
#232
Tragic
4.7%
Immigrants | Immigrants
2.6
/100
|
#233
Tragic
4.7%
Soviet Union
2.6
/100
|
#234
Tragic
4.7%

Demographics Similar to Bolivians by Unemployment Among Ages 45 to 54 years

In terms of unemployment among ages 45 to 54 years, the demographic groups most similar to Bolivians are Scottish (4.1%, a difference of 0.0%), Carpatho Rusyn (4.1%, a difference of 0.12%), Immigrants from Moldova (4.1%, a difference of 0.48%), Welsh (4.1%, a difference of 0.54%), and Belgian (4.1%, a difference of 0.68%).
DemographicsRating | RankUnemployment Among Ages 45 to 54 years
Germans
100.0
/100
|
#18
Exceptional
4.1%
Swiss
100.0
/100
|
#19
Exceptional
4.1%
English
100.0
/100
|
#20
Exceptional
4.1%
Europeans
100.0
/100
|
#21
Exceptional
4.1%
Yugoslavians
100.0
/100
|
#22
Exceptional
4.1%
Bulgarians
100.0
/100
|
#23
Exceptional
4.1%
Carpatho Rusyns
100.0
/100
|
#24
Exceptional
4.1%
Bolivians
99.9
/100
|
#25
Exceptional
4.1%
Scottish
99.9
/100
|
#26
Exceptional
4.1%
Immigrants | Moldova
99.9
/100
|
#27
Exceptional
4.1%
Welsh
99.9
/100
|
#28
Exceptional
4.1%
Belgians
99.9
/100
|
#29
Exceptional
4.1%
British
99.9
/100
|
#30
Exceptional
4.1%
Bhutanese
99.9
/100
|
#31
Exceptional
4.2%
Slovenes
99.9
/100
|
#32
Exceptional
4.2%