Inupiat vs Barbadian Unemployment Among Ages 55 to 59 years
COMPARE
Inupiat
Barbadian
Unemployment Among Ages 55 to 59 years
Unemployment Among Ages 55 to 59 years Comparison
Inupiat
Barbadians
9.0%
UNEMPLOYMENT AMONG AGES 55 TO 59 YEARS
0.0/ 100
METRIC RATING
344th/ 347
METRIC RANK
5.3%
UNEMPLOYMENT AMONG AGES 55 TO 59 YEARS
0.0/ 100
METRIC RATING
296th/ 347
METRIC RANK
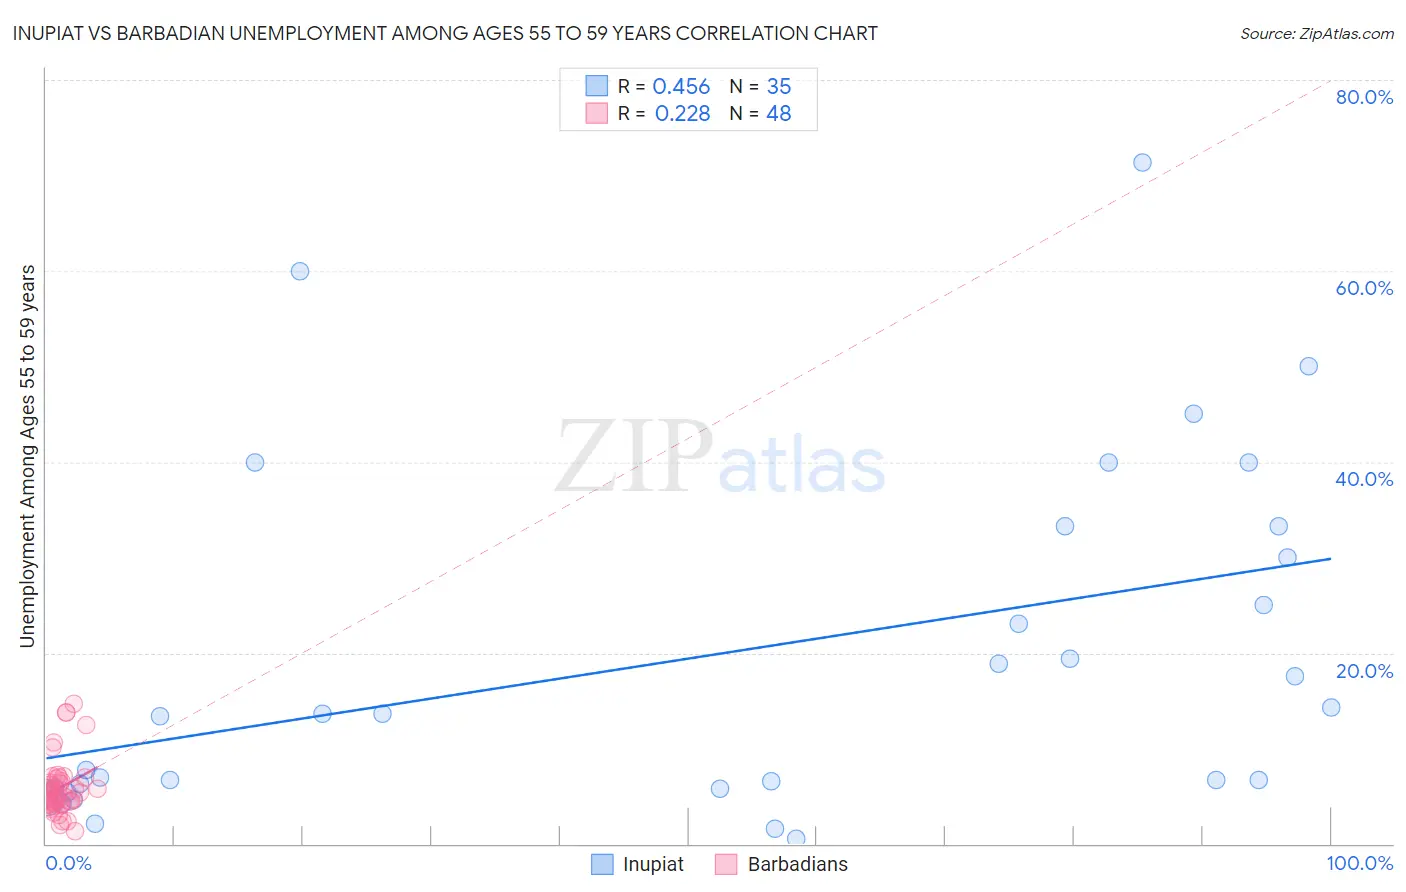
Inupiat vs Barbadian Unemployment Among Ages 55 to 59 years Correlation Chart
The statistical analysis conducted on geographies consisting of 93,729,487 people shows a moderate positive correlation between the proportion of Inupiat and unemployment rate among population between the ages 55 and 59 in the United States with a correlation coefficient (R) of 0.456 and weighted average of 9.0%. Similarly, the statistical analysis conducted on geographies consisting of 137,668,651 people shows a weak positive correlation between the proportion of Barbadians and unemployment rate among population between the ages 55 and 59 in the United States with a correlation coefficient (R) of 0.228 and weighted average of 5.3%, a difference of 69.5%.
Unemployment Among Ages 55 to 59 years Correlation Summary
| Measurement | Inupiat | Barbadian |
| Minimum | 0.50% | 1.3% |
| Maximum | 71.4% | 14.6% |
| Range | 70.9% | 13.3% |
| Mean | 19.5% | 5.9% |
| Median | 13.6% | 5.0% |
| Interquartile 25% (IQ1) | 6.0% | 4.4% |
| Interquartile 75% (IQ3) | 33.3% | 6.6% |
| Interquartile Range (IQR) | 27.3% | 2.3% |
| Standard Deviation (Sample) | 18.2% | 2.9% |
| Standard Deviation (Population) | 17.9% | 2.9% |
Similar Demographics by Unemployment Among Ages 55 to 59 years
Demographics Similar to Inupiat by Unemployment Among Ages 55 to 59 years
In terms of unemployment among ages 55 to 59 years, the demographic groups most similar to Inupiat are Yakama (8.9%, a difference of 1.2%), Tohono O'odham (9.3%, a difference of 3.0%), Hopi (8.1%, a difference of 11.3%), Menominee (10.5%, a difference of 16.6%), and Shoshone (7.4%, a difference of 22.6%).
| Demographics | Rating | Rank | Unemployment Among Ages 55 to 59 years |
| Pima | 0.0 /100 | #333 | Tragic 6.6% |
| Pueblo | 0.0 /100 | #334 | Tragic 6.7% |
| Colville | 0.0 /100 | #335 | Tragic 6.7% |
| Navajo | 0.0 /100 | #336 | Tragic 6.7% |
| Paiute | 0.0 /100 | #337 | Tragic 6.8% |
| Immigrants | Yemen | 0.0 /100 | #338 | Tragic 6.9% |
| Puerto Ricans | 0.0 /100 | #339 | Tragic 7.0% |
| Alaskan Athabascans | 0.0 /100 | #340 | Tragic 7.1% |
| Shoshone | 0.0 /100 | #341 | Tragic 7.4% |
| Hopi | 0.0 /100 | #342 | Tragic 8.1% |
| Yakama | 0.0 /100 | #343 | Tragic 8.9% |
| Inupiat | 0.0 /100 | #344 | Tragic 9.0% |
| Tohono O'odham | 0.0 /100 | #345 | Tragic 9.3% |
| Menominee | 0.0 /100 | #346 | Tragic 10.5% |
| Yup'ik | 0.0 /100 | #347 | Tragic 13.9% |
Demographics Similar to Barbadians by Unemployment Among Ages 55 to 59 years
In terms of unemployment among ages 55 to 59 years, the demographic groups most similar to Barbadians are Dutch West Indian (5.3%, a difference of 0.040%), Cajun (5.3%, a difference of 0.16%), Immigrants from Mexico (5.3%, a difference of 0.22%), Immigrants from Grenada (5.3%, a difference of 0.28%), and British West Indian (5.3%, a difference of 0.47%).
| Demographics | Rating | Rank | Unemployment Among Ages 55 to 59 years |
| Immigrants | Central America | 0.0 /100 | #289 | Tragic 5.3% |
| Sioux | 0.0 /100 | #290 | Tragic 5.3% |
| Trinidadians and Tobagonians | 0.0 /100 | #291 | Tragic 5.3% |
| British West Indians | 0.0 /100 | #292 | Tragic 5.3% |
| Immigrants | Grenada | 0.0 /100 | #293 | Tragic 5.3% |
| Cajuns | 0.0 /100 | #294 | Tragic 5.3% |
| Dutch West Indians | 0.0 /100 | #295 | Tragic 5.3% |
| Barbadians | 0.0 /100 | #296 | Tragic 5.3% |
| Immigrants | Mexico | 0.0 /100 | #297 | Tragic 5.3% |
| Hispanics or Latinos | 0.0 /100 | #298 | Tragic 5.4% |
| Cape Verdeans | 0.0 /100 | #299 | Tragic 5.4% |
| Immigrants | St. Vincent and the Grenadines | 0.0 /100 | #300 | Tragic 5.4% |
| Immigrants | Dominica | 0.0 /100 | #301 | Tragic 5.5% |
| Sierra Leoneans | 0.0 /100 | #302 | Tragic 5.5% |
| Marshallese | 0.0 /100 | #303 | Tragic 5.5% |