Indonesian vs Immigrants from Western Asia Unemployment Among Ages 35 to 44 years

COMPARE

Indonesian
Race
Ancestry
AfghanAfricanAlaska NativeAlaskan AthabascanAlbanianAleutAlsatianAmericanApacheArabArapahoArgentineanArmenianAssyrian/Chaldean/SyriacAustralianAustrianBahamianBangladeshiBarbadianBasqueBelgianBelizeanBermudanBhutaneseBlackfeetBolivianBrazilianBritishBritish West IndianBulgarianBurmeseCajunCambodianCanadianCape VerdeanCarpatho RusynCelticCentral AmericanCentral American IndianCherokeeCheyenneChickasawChileanChineseChippewaChoctawColombianColvilleComancheCosta RicanCreeCreekCroatianCrowCubanCypriotCzechCzechoslovakianDanishDelawareDominicanDutchDutch West IndianEastern EuropeanEcuadorianEgyptianEnglishEstonianEthiopianEuropeanFijianFilipinoFinnishFrenchFrench American IndianFrench CanadianGermanGerman RussianGhanaianGreekGuamanian/ChamorroGuatemalanGuyaneseHaitianHmongHonduranHopiHoumaHungarianIcelanderIndian (Asian)IndonesianInupiatIranianIraqiIrishIroquoisIsraeliItalianJamaicanJapaneseJordanianKenyanKiowaKoreanLaotianLatvianLebaneseLiberianLithuanianLumbeeLuxembourgerMacedonianMalaysianMalteseMarshalleseMenomineeMexicanMexican American IndianMongolianMoroccanNative HawaiianNavajoNepaleseNew ZealanderNicaraguanNigerianNorthern EuropeanNorwegianOkinawanOsageOttawaPaiutePakistaniPalestinianPanamanianParaguayanPennsylvania GermanPeruvianPimaPolishPortuguesePotawatomiPuebloPuerto RicanPuget Sound SalishRomanianRussianSalvadoranSamoanScandinavianScotch-IrishScottishSeminoleSenegaleseSerbianShoshoneSierra LeoneanSiouxSlavicSlovakSloveneSomaliSouth AfricanSouth AmericanSouth American IndianSoviet UnionSpaniardSpanishSpanish AmericanSpanish American IndianSri LankanSubsaharan AfricanSudaneseSwedishSwissSyrianTaiwaneseThaiTlingit-HaidaTohono O'OdhamTonganTrinidadian and TobagonianTsimshianTurkishU.S. Virgin IslanderUgandanUkrainianUruguayanUteVenezuelanVietnameseWelshWest IndianYakamaYaquiYugoslavianYumanYup'ikZimbabwean
Immigration
NonimmigrantsImmigrantsAfghanistanAfricaAlbaniaArgentinaArmeniaAsiaAustraliaAustriaBahamasBangladeshBarbadosBelarusBelgiumBelizeBoliviaBosnia and HerzegovinaBrazilBulgariaBurma/MyanmarCabo VerdeCambodiaCameroonCanadaCaribbeanCentral AmericaChileChinaColombiaCongoCosta RicaCroatiaCubaCzechoslovakiaDenmarkDominicaDominican RepublicEastern AfricaEastern AsiaEastern EuropeEcuadorEgyptEl SalvadorEnglandEritreaEthiopiaEuropeFijiFranceGermanyGhanaGreeceGrenadaGuatemalaGuyanaHaitiHondurasHong KongHungaryIndiaIndonesiaIranIraqIrelandIsraelItalyJamaicaJapanJordanKazakhstanKenyaKoreaKuwaitLaosLatin AmericaLatviaLebanonLiberiaLithuaniaMalaysiaMexicoMicronesiaMiddle AfricaMoldovaMoroccoNepalNetherlandsNicaraguaNigeriaNorth AmericaNorth MacedoniaNorthern AfricaNorthern EuropeNorwayOceaniaPakistanPanamaPeruPhilippinesPolandPortugalRomaniaRussiaSaudi ArabiaScotlandSenegalSerbiaSierra LeoneSingaporeSomaliaSouth AfricaSouth AmericaSouth Central AsiaSouth Eastern AsiaSouthern EuropeSpainSri LankaSt. Vincent and the GrenadinesSudanSwedenSwitzerlandSyriaTaiwanThailandTrinidad and TobagoTurkeyUgandaUkraineUruguayUzbekistanVenezuelaVietnamWest IndiesWestern AfricaWestern EuropeYemenZaireZimbabweAzores
Immigrants from Western Asia
Race
Ancestry
AfghanAfricanAlaska NativeAlaskan AthabascanAlbanianAleutAlsatianAmericanApacheArabArapahoArgentineanArmenianAssyrian/Chaldean/SyriacAustralianAustrianBahamianBangladeshiBarbadianBasqueBelgianBelizeanBermudanBhutaneseBlackfeetBolivianBrazilianBritishBritish West IndianBulgarianBurmeseCajunCambodianCanadianCape VerdeanCarpatho RusynCelticCentral AmericanCentral American IndianCherokeeCheyenneChickasawChileanChineseChippewaChoctawColombianColvilleComancheCosta RicanCreeCreekCroatianCrowCubanCypriotCzechCzechoslovakianDanishDelawareDominicanDutchDutch West IndianEastern EuropeanEcuadorianEgyptianEnglishEstonianEthiopianEuropeanFijianFilipinoFinnishFrenchFrench American IndianFrench CanadianGermanGerman RussianGhanaianGreekGuamanian/ChamorroGuatemalanGuyaneseHaitianHmongHonduranHopiHoumaHungarianIcelanderIndian (Asian)InupiatIranianIraqiIrishIroquoisIsraeliItalianJamaicanJapaneseJordanianKenyanKiowaKoreanLaotianLatvianLebaneseLiberianLithuanianLumbeeLuxembourgerMacedonianMalaysianMalteseMarshalleseMenomineeMexicanMexican American IndianMongolianMoroccanNative HawaiianNavajoNepaleseNew ZealanderNicaraguanNigerianNorthern EuropeanNorwegianOkinawanOsageOttawaPaiutePakistaniPalestinianPanamanianParaguayanPennsylvania GermanPeruvianPimaPolishPortuguesePotawatomiPuebloPuerto RicanPuget Sound SalishRomanianRussianSalvadoranSamoanScandinavianScotch-IrishScottishSeminoleSenegaleseSerbianShoshoneSierra LeoneanSiouxSlavicSlovakSloveneSomaliSouth AfricanSouth AmericanSouth American IndianSoviet UnionSpaniardSpanishSpanish AmericanSpanish American IndianSri LankanSubsaharan AfricanSudaneseSwedishSwissSyrianTaiwaneseThaiTlingit-HaidaTohono O'OdhamTonganTrinidadian and TobagonianTsimshianTurkishU.S. Virgin IslanderUgandanUkrainianUruguayanUteVenezuelanVietnameseWelshWest IndianYakamaYaquiYugoslavianYumanYup'ikZimbabwean
Immigration
NonimmigrantsImmigrantsAfghanistanAfricaAlbaniaArgentinaArmeniaAsiaAustraliaAustriaBahamasBangladeshBarbadosBelarusBelgiumBelizeBoliviaBosnia and HerzegovinaBrazilBulgariaBurma/MyanmarCabo VerdeCambodiaCameroonCanadaCaribbeanCentral AmericaChileChinaColombiaCongoCosta RicaCroatiaCubaCzechoslovakiaDenmarkDominicaDominican RepublicEastern AfricaEastern AsiaEastern EuropeEcuadorEgyptEl SalvadorEnglandEritreaEthiopiaEuropeFijiFranceGermanyGhanaGreeceGrenadaGuatemalaGuyanaHaitiHondurasHong KongHungaryIndiaIndonesiaIranIraqIrelandIsraelItalyJamaicaJapanJordanKazakhstanKenyaKoreaKuwaitLaosLatin AmericaLatviaLebanonLiberiaLithuaniaMalaysiaMexicoMicronesiaMiddle AfricaMoldovaMoroccoNepalNetherlandsNicaraguaNigeriaNorth AmericaNorth MacedoniaNorthern AfricaNorthern EuropeNorwayOceaniaPakistanPanamaPeruPhilippinesPolandPortugalRomaniaRussiaSaudi ArabiaScotlandSenegalSerbiaSierra LeoneSingaporeSomaliaSouth AfricaSouth AmericaSouth Central AsiaSouth Eastern AsiaSouthern EuropeSpainSri LankaSt. Vincent and the GrenadinesSudanSwedenSwitzerlandSyriaTaiwanThailandTrinidad and TobagoTurkeyUgandaUkraineUruguayUzbekistanVenezuelaVietnamWest IndiesWestern AfricaWestern AsiaWestern EuropeYemenZaireZimbabweAzores
Unemployment Among Ages 35 to 44 years
Income
Poverty
Unemployment
Labor Participation
Family Structure
Vehicle Availability
Education Level
Disability

Unemployment Among Ages 35 to 44 years Comparison

Indonesians

Immigrants from Western Asia

Average
Poor
4.7%
UNEMPLOYMENT AMONG AGES 35 TO 44 YEARS
51.7/ 100
METRIC RATING
171st/ 347
METRIC RANK
4.8%
UNEMPLOYMENT AMONG AGES 35 TO 44 YEARS
16.6/ 100
METRIC RATING
207th/ 347
METRIC RANK

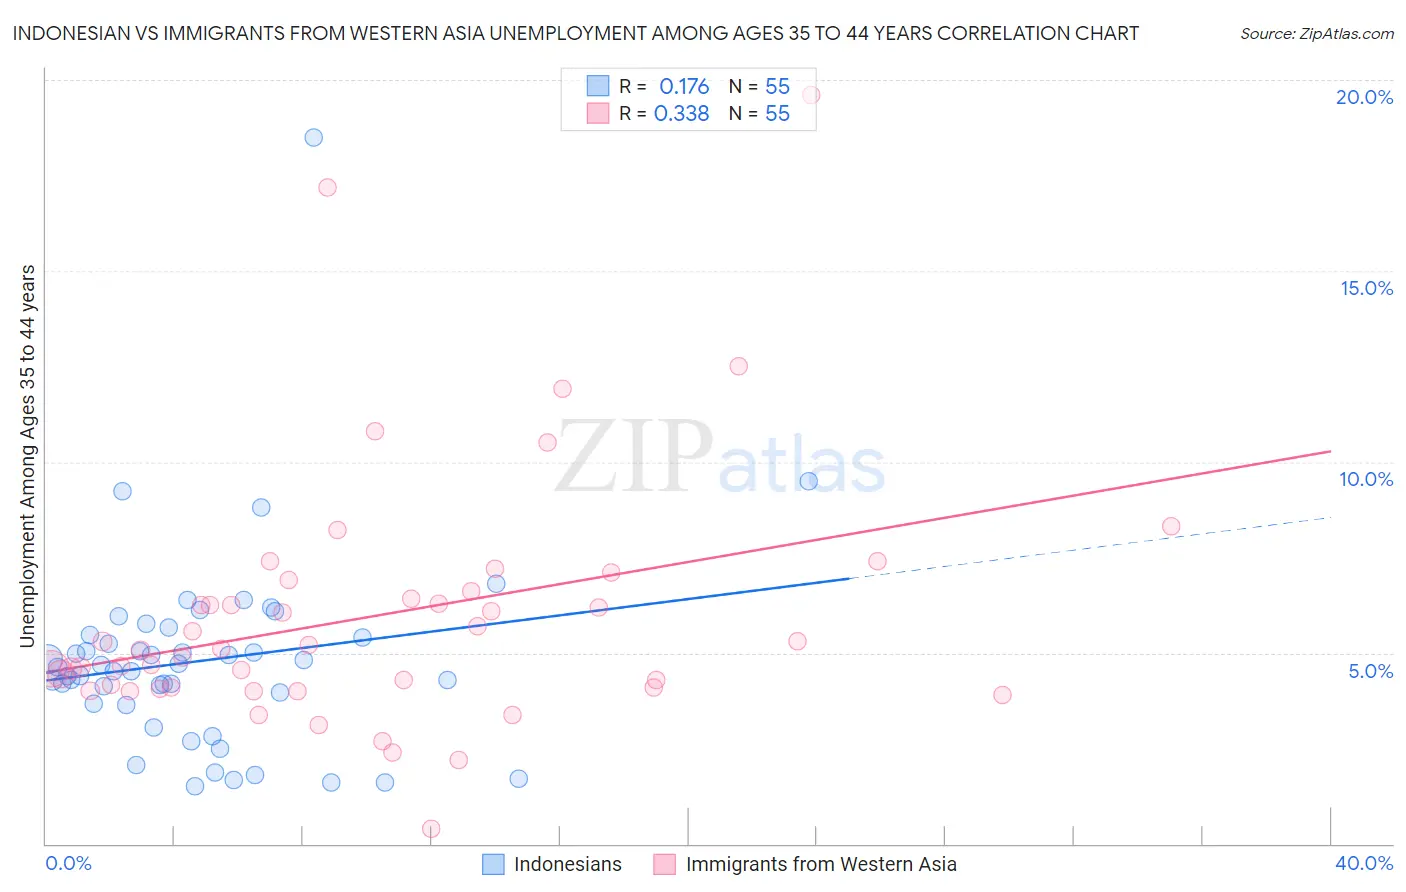
Indonesian vs Immigrants from Western Asia Unemployment Among Ages 35 to 44 years Correlation Chart

The statistical analysis conducted on geographies consisting of 161,704,474 people shows a poor positive correlation between the proportion of Indonesians and unemployment rate among population between the ages 35 and 44 in the United States with a correlation coefficient (R) of 0.176 and weighted average of 4.7%. Similarly, the statistical analysis conducted on geographies consisting of 396,093,613 people shows a mild positive correlation between the proportion of Immigrants from Western Asia and unemployment rate among population between the ages 35 and 44 in the United States with a correlation coefficient (R) of 0.338 and weighted average of 4.8%, a difference of 3.0%.
Indonesian vs Immigrants from Western Asia Unemployment Among Ages 35 to 44 years

Unemployment Among Ages 35 to 44 years Correlation Summary

MeasurementIndonesianImmigrants from Western Asia
Minimum1.5%0.40%
Maximum18.5%19.6%
Range17.0%19.2%
Mean4.8%6.0%
Median4.6%5.1%
Interquartile 25% (IQ1)3.7%4.1%
Interquartile 75% (IQ3)5.5%6.6%
Interquartile Range (IQR)1.8%2.5%
Standard Deviation (Sample)2.6%3.3%
Standard Deviation (Population)2.6%3.3%

Similar Demographics by Unemployment Among Ages 35 to 44 years

Demographics Similar to Indonesians by Unemployment Among Ages 35 to 44 years

In terms of unemployment among ages 35 to 44 years, the demographic groups most similar to Indonesians are Lebanese (4.7%, a difference of 0.020%), Immigrants from Indonesia (4.7%, a difference of 0.060%), Iraqi (4.7%, a difference of 0.060%), Pennsylvania German (4.7%, a difference of 0.090%), and Arab (4.7%, a difference of 0.10%).
DemographicsRating | RankUnemployment Among Ages 35 to 44 years
Immigrants | Morocco
57.2
/100
|
#164
Average
4.7%
German Russians
57.2
/100
|
#165
Average
4.7%
French
55.6
/100
|
#166
Average
4.7%
Peruvians
54.4
/100
|
#167
Average
4.7%
Arabs
53.1
/100
|
#168
Average
4.7%
Pennsylvania Germans
53.0
/100
|
#169
Average
4.7%
Immigrants | Indonesia
52.6
/100
|
#170
Average
4.7%
Indonesians
51.7
/100
|
#171
Average
4.7%
Lebanese
51.4
/100
|
#172
Average
4.7%
Iraqis
50.9
/100
|
#173
Average
4.7%
Afghans
50.0
/100
|
#174
Average
4.7%
Immigrants | Germany
48.9
/100
|
#175
Average
4.7%
Immigrants | Uganda
48.1
/100
|
#176
Average
4.7%
Slovaks
44.6
/100
|
#177
Average
4.7%
South American Indians
40.7
/100
|
#178
Average
4.7%

Demographics Similar to Immigrants from Western Asia by Unemployment Among Ages 35 to 44 years

In terms of unemployment among ages 35 to 44 years, the demographic groups most similar to Immigrants from Western Asia are French Canadian (4.8%, a difference of 0.020%), Soviet Union (4.8%, a difference of 0.21%), Spaniard (4.8%, a difference of 0.25%), Immigrants from Philippines (4.8%, a difference of 0.37%), and Uruguayan (4.8%, a difference of 0.39%).
DemographicsRating | RankUnemployment Among Ages 35 to 44 years
Immigrants | Ukraine
21.4
/100
|
#200
Fair
4.8%
Ugandans
21.4
/100
|
#201
Fair
4.8%
Immigrants | Afghanistan
20.2
/100
|
#202
Fair
4.8%
Uruguayans
20.0
/100
|
#203
Fair
4.8%
Immigrants | Philippines
19.8
/100
|
#204
Poor
4.8%
Spaniards
18.7
/100
|
#205
Poor
4.8%
Soviet Union
18.4
/100
|
#206
Poor
4.8%
Immigrants | Western Asia
16.6
/100
|
#207
Poor
4.8%
French Canadians
16.5
/100
|
#208
Poor
4.8%
Immigrants | Uruguay
11.5
/100
|
#209
Poor
4.9%
Immigrants | Cameroon
11.4
/100
|
#210
Poor
4.9%
Immigrants | Nonimmigrants
9.4
/100
|
#211
Tragic
4.9%
Fijians
8.7
/100
|
#212
Tragic
4.9%
Osage
8.6
/100
|
#213
Tragic
4.9%
Immigrants | Africa
8.2
/100
|
#214
Tragic
4.9%