Indian (Asian) vs Immigrants from Senegal Unemployment Among Youth under 25 years

COMPARE

Indian (Asian)
Race
Ancestry
AfghanAfricanAlaska NativeAlaskan AthabascanAlbanianAleutAlsatianAmericanApacheArabArapahoArgentineanArmenianAssyrian/Chaldean/SyriacAustralianAustrianBahamianBangladeshiBarbadianBasqueBelgianBelizeanBermudanBhutaneseBlackfeetBolivianBrazilianBritishBritish West IndianBulgarianBurmeseCajunCambodianCanadianCape VerdeanCarpatho RusynCelticCentral AmericanCentral American IndianCherokeeCheyenneChickasawChileanChineseChippewaChoctawColombianColvilleComancheCosta RicanCreeCreekCroatianCrowCubanCypriotCzechCzechoslovakianDanishDelawareDominicanDutchDutch West IndianEastern EuropeanEcuadorianEgyptianEnglishEstonianEthiopianEuropeanFijianFilipinoFinnishFrenchFrench American IndianFrench CanadianGermanGerman RussianGhanaianGreekGuamanian/ChamorroGuatemalanGuyaneseHaitianHmongHonduranHopiHoumaHungarianIcelanderIndian (Asian)IndonesianInupiatIranianIraqiIrishIroquoisIsraeliItalianJamaicanJapaneseJordanianKenyanKiowaKoreanLaotianLatvianLebaneseLiberianLithuanianLumbeeLuxembourgerMacedonianMalaysianMalteseMarshalleseMenomineeMexicanMexican American IndianMongolianMoroccanNative HawaiianNavajoNepaleseNew ZealanderNicaraguanNigerianNorthern EuropeanNorwegianOkinawanOsageOttawaPaiutePakistaniPalestinianPanamanianParaguayanPennsylvania GermanPeruvianPimaPolishPortuguesePotawatomiPuebloPuerto RicanPuget Sound SalishRomanianRussianSalvadoranSamoanScandinavianScotch-IrishScottishSeminoleSenegaleseSerbianShoshoneSierra LeoneanSiouxSlavicSlovakSloveneSomaliSouth AfricanSouth AmericanSouth American IndianSoviet UnionSpaniardSpanishSpanish AmericanSpanish American IndianSri LankanSubsaharan AfricanSudaneseSwedishSwissSyrianTaiwaneseThaiTlingit-HaidaTohono O'OdhamTonganTrinidadian and TobagonianTsimshianTurkishU.S. Virgin IslanderUgandanUkrainianUruguayanUteVenezuelanVietnameseWelshWest IndianYakamaYaquiYugoslavianYumanYup'ikZimbabwean
Immigration
NonimmigrantsImmigrantsAfghanistanAfricaAlbaniaArgentinaArmeniaAsiaAustraliaAustriaBahamasBangladeshBarbadosBelarusBelgiumBelizeBoliviaBosnia and HerzegovinaBrazilBulgariaBurma/MyanmarCabo VerdeCambodiaCameroonCanadaCaribbeanCentral AmericaChileChinaColombiaCongoCosta RicaCroatiaCubaCzechoslovakiaDenmarkDominicaDominican RepublicEastern AfricaEastern AsiaEastern EuropeEcuadorEgyptEl SalvadorEnglandEritreaEthiopiaEuropeFijiFranceGermanyGhanaGreeceGrenadaGuatemalaGuyanaHaitiHondurasHong KongHungaryIndiaIndonesiaIranIraqIrelandIsraelItalyJamaicaJapanJordanKazakhstanKenyaKoreaKuwaitLaosLatin AmericaLatviaLebanonLiberiaLithuaniaMalaysiaMexicoMicronesiaMiddle AfricaMoldovaMoroccoNepalNetherlandsNicaraguaNigeriaNorth AmericaNorth MacedoniaNorthern AfricaNorthern EuropeNorwayOceaniaPakistanPanamaPeruPhilippinesPolandPortugalRomaniaRussiaSaudi ArabiaScotlandSerbiaSierra LeoneSingaporeSomaliaSouth AfricaSouth AmericaSouth Central AsiaSouth Eastern AsiaSouthern EuropeSpainSri LankaSt. Vincent and the GrenadinesSudanSwedenSwitzerlandSyriaTaiwanThailandTrinidad and TobagoTurkeyUgandaUkraineUruguayUzbekistanVenezuelaVietnamWest IndiesWestern AfricaWestern AsiaWestern EuropeYemenZaireZimbabweAzores
Immigrants from Senegal
Race
Ancestry
AfghanAfricanAlaska NativeAlaskan AthabascanAlbanianAleutAlsatianAmericanApacheArabArapahoArgentineanArmenianAssyrian/Chaldean/SyriacAustralianAustrianBahamianBangladeshiBarbadianBasqueBelgianBelizeanBermudanBhutaneseBlackfeetBolivianBrazilianBritishBritish West IndianBulgarianBurmeseCajunCambodianCanadianCape VerdeanCarpatho RusynCelticCentral AmericanCentral American IndianCherokeeCheyenneChickasawChileanChineseChippewaChoctawColombianColvilleComancheCosta RicanCreeCreekCroatianCrowCubanCypriotCzechCzechoslovakianDanishDelawareDominicanDutchDutch West IndianEastern EuropeanEcuadorianEgyptianEnglishEstonianEthiopianEuropeanFijianFilipinoFinnishFrenchFrench American IndianFrench CanadianGermanGerman RussianGhanaianGreekGuamanian/ChamorroGuatemalanGuyaneseHaitianHmongHonduranHopiHoumaHungarianIcelanderIndonesianInupiatIranianIraqiIrishIroquoisIsraeliItalianJamaicanJapaneseJordanianKenyanKiowaKoreanLaotianLatvianLebaneseLiberianLithuanianLumbeeLuxembourgerMacedonianMalaysianMalteseMarshalleseMenomineeMexicanMexican American IndianMongolianMoroccanNative HawaiianNavajoNepaleseNew ZealanderNicaraguanNigerianNorthern EuropeanNorwegianOkinawanOsageOttawaPaiutePakistaniPalestinianPanamanianParaguayanPennsylvania GermanPeruvianPimaPolishPortuguesePotawatomiPuebloPuerto RicanPuget Sound SalishRomanianRussianSalvadoranSamoanScandinavianScotch-IrishScottishSeminoleSenegaleseSerbianShoshoneSierra LeoneanSiouxSlavicSlovakSloveneSomaliSouth AfricanSouth AmericanSouth American IndianSoviet UnionSpaniardSpanishSpanish AmericanSpanish American IndianSri LankanSubsaharan AfricanSudaneseSwedishSwissSyrianTaiwaneseThaiTlingit-HaidaTohono O'OdhamTonganTrinidadian and TobagonianTsimshianTurkishU.S. Virgin IslanderUgandanUkrainianUruguayanUteVenezuelanVietnameseWelshWest IndianYakamaYaquiYugoslavianYumanYup'ikZimbabwean
Immigration
NonimmigrantsImmigrantsAfghanistanAfricaAlbaniaArgentinaArmeniaAsiaAustraliaAustriaBahamasBangladeshBarbadosBelarusBelgiumBelizeBoliviaBosnia and HerzegovinaBrazilBulgariaBurma/MyanmarCabo VerdeCambodiaCameroonCanadaCaribbeanCentral AmericaChileChinaColombiaCongoCosta RicaCroatiaCubaCzechoslovakiaDenmarkDominicaDominican RepublicEastern AfricaEastern AsiaEastern EuropeEcuadorEgyptEl SalvadorEnglandEritreaEthiopiaEuropeFijiFranceGermanyGhanaGreeceGrenadaGuatemalaGuyanaHaitiHondurasHong KongHungaryIndiaIndonesiaIranIraqIrelandIsraelItalyJamaicaJapanJordanKazakhstanKenyaKoreaKuwaitLaosLatin AmericaLatviaLebanonLiberiaLithuaniaMalaysiaMexicoMicronesiaMiddle AfricaMoldovaMoroccoNepalNetherlandsNicaraguaNigeriaNorth AmericaNorth MacedoniaNorthern AfricaNorthern EuropeNorwayOceaniaPakistanPanamaPeruPhilippinesPolandPortugalRomaniaRussiaSaudi ArabiaScotlandSenegalSerbiaSierra LeoneSingaporeSomaliaSouth AfricaSouth AmericaSouth Central AsiaSouth Eastern AsiaSouthern EuropeSpainSri LankaSt. Vincent and the GrenadinesSudanSwedenSwitzerlandSyriaTaiwanThailandTrinidad and TobagoTurkeyUgandaUkraineUruguayUzbekistanVenezuelaVietnamWest IndiesWestern AfricaWestern AsiaWestern EuropeYemenZaireZimbabweAzores
Unemployment Among Youth under 25 years
Income
Poverty
Unemployment
Labor Participation
Family Structure
Vehicle Availability
Education Level
Disability

Unemployment Among Youth under 25 years Comparison

Indians (Asian)

Immigrants from Senegal

Good
Tragic
11.5%
UNEMPLOYMENT AMONG YOUTH UNDER 25 YEARS
65.1/ 100
METRIC RATING
157th/ 347
METRIC RANK
13.8%
UNEMPLOYMENT AMONG YOUTH UNDER 25 YEARS
0.0/ 100
METRIC RATING
301st/ 347
METRIC RANK

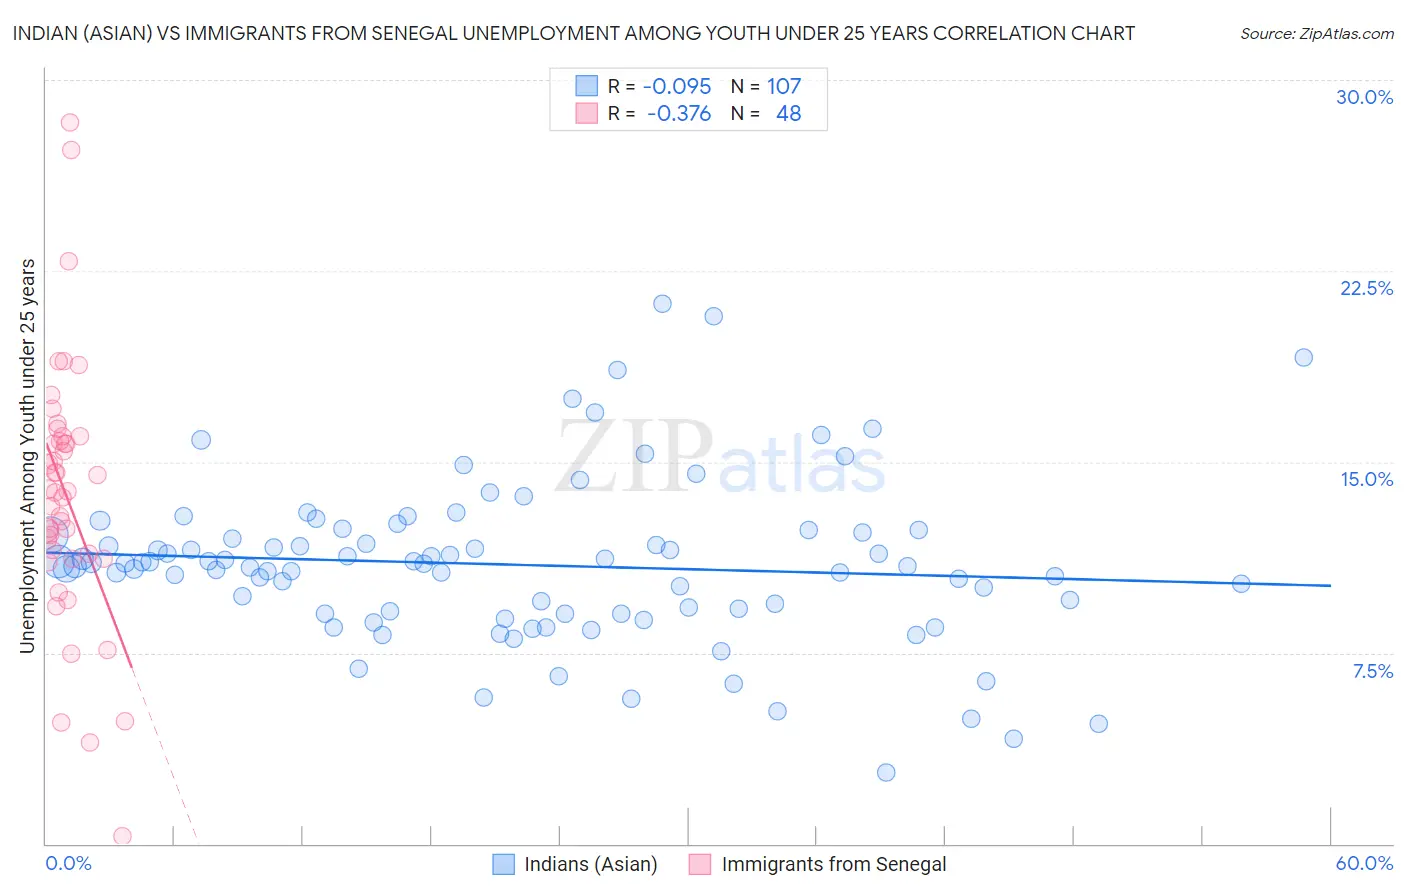
Indian (Asian) vs Immigrants from Senegal Unemployment Among Youth under 25 years Correlation Chart

The statistical analysis conducted on geographies consisting of 485,546,701 people shows a slight negative correlation between the proportion of Indians (Asian) and unemployment rate among youth under the age of 25 in the United States with a correlation coefficient (R) of -0.095 and weighted average of 11.5%. Similarly, the statistical analysis conducted on geographies consisting of 90,014,443 people shows a mild negative correlation between the proportion of Immigrants from Senegal and unemployment rate among youth under the age of 25 in the United States with a correlation coefficient (R) of -0.376 and weighted average of 13.8%, a difference of 19.9%.
Indian (Asian) vs Immigrants from Senegal Unemployment Among Youth under 25 years

Unemployment Among Youth under 25 years Correlation Summary

MeasurementIndian (Asian)Immigrants from Senegal
Minimum2.8%0.30%
Maximum21.2%28.3%
Range18.4%28.0%
Mean11.0%13.7%
Median11.0%13.8%
Interquartile 25% (IQ1)9.1%11.3%
Interquartile 75% (IQ3)12.2%15.9%
Interquartile Range (IQR)3.2%4.6%
Standard Deviation (Sample)3.2%5.1%
Standard Deviation (Population)3.2%5.1%

Similar Demographics by Unemployment Among Youth under 25 years

Demographics Similar to Indians (Asian) by Unemployment Among Youth under 25 years

In terms of unemployment among youth under 25 years, the demographic groups most similar to Indians (Asian) are Immigrants from Turkey (11.5%, a difference of 0.020%), Immigrants from Western Europe (11.5%, a difference of 0.020%), Immigrants from Germany (11.5%, a difference of 0.030%), Immigrants from Eastern Asia (11.5%, a difference of 0.030%), and Ukrainian (11.5%, a difference of 0.040%).
DemographicsRating | RankUnemployment Among Youth under 25 years
Immigrants | Switzerland
71.6
/100
|
#150
Good
11.5%
Uruguayans
70.4
/100
|
#151
Good
11.5%
Iraqis
68.3
/100
|
#152
Good
11.5%
Immigrants | Czechoslovakia
67.1
/100
|
#153
Good
11.5%
Immigrants | Asia
66.7
/100
|
#154
Good
11.5%
Immigrants | Romania
66.3
/100
|
#155
Good
11.5%
Immigrants | Germany
65.9
/100
|
#156
Good
11.5%
Indians (Asian)
65.1
/100
|
#157
Good
11.5%
Immigrants | Turkey
64.8
/100
|
#158
Good
11.5%
Immigrants | Western Europe
64.7
/100
|
#159
Good
11.5%
Immigrants | Eastern Asia
64.5
/100
|
#160
Good
11.5%
Ukrainians
64.3
/100
|
#161
Good
11.5%
Immigrants | Northern Africa
62.7
/100
|
#162
Good
11.5%
Immigrants | Kazakhstan
62.7
/100
|
#163
Good
11.5%
Immigrants | Laos
62.4
/100
|
#164
Good
11.5%

Demographics Similar to Immigrants from Senegal by Unemployment Among Youth under 25 years

In terms of unemployment among youth under 25 years, the demographic groups most similar to Immigrants from Senegal are Immigrants from Sierra Leone (13.8%, a difference of 0.050%), Belizean (13.8%, a difference of 0.080%), Houma (13.8%, a difference of 0.090%), Immigrants from Cabo Verde (13.8%, a difference of 0.17%), and Tohono O'odham (13.8%, a difference of 0.38%).
DemographicsRating | RankUnemployment Among Youth under 25 years
Immigrants | Caribbean
0.0
/100
|
#294
Tragic
13.5%
Chippewa
0.0
/100
|
#295
Tragic
13.5%
Senegalese
0.0
/100
|
#296
Tragic
13.5%
U.S. Virgin Islanders
0.0
/100
|
#297
Tragic
13.6%
Shoshone
0.0
/100
|
#298
Tragic
13.7%
Tohono O'odham
0.0
/100
|
#299
Tragic
13.8%
Immigrants | Cabo Verde
0.0
/100
|
#300
Tragic
13.8%
Immigrants | Senegal
0.0
/100
|
#301
Tragic
13.8%
Immigrants | Sierra Leone
0.0
/100
|
#302
Tragic
13.8%
Belizeans
0.0
/100
|
#303
Tragic
13.8%
Houma
0.0
/100
|
#304
Tragic
13.8%
Haitians
0.0
/100
|
#305
Tragic
13.9%
Pueblo
0.0
/100
|
#306
Tragic
13.9%
Immigrants | Haiti
0.0
/100
|
#307
Tragic
14.0%
Immigrants | Belize
0.0
/100
|
#308
Tragic
14.0%